BNBUSD Price Analysis – January 22
An increase in the sellers’ pressure may push the price below the support level of $36 and the daily candlestick may close below the level, the price will decline further to test the $31 and $27 support level. Inability to break down the support level of $36, the bullish trend may continue to target the resistance levels at $41, $44, and $48.
GBP/JPY Market
Key levels:
Supply levels: $41, $44, $48
Demand levels: $36, $31, $27
BNBUSD Long-term trend: Bearish
BNBUSD is bearish in the daily chart. The price soars towards the resistance level of $44 after it breaks up the resistance levels of $37 and $41. The price pulled back to retest the broken level of $31. The bulls increased the price and the resistance level of $44 is tested a second time but unable to penetrate the level. The bears are taken over the BNBUSD market as the bearish candles are forming.
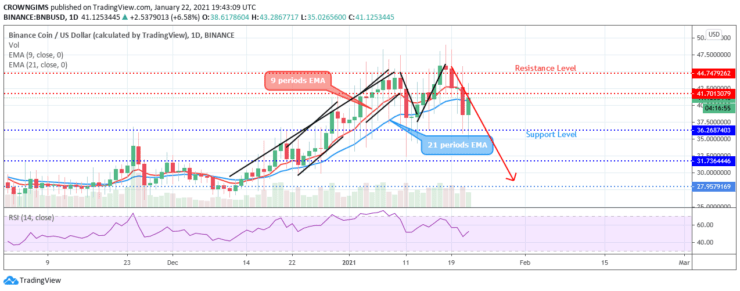
The price has penetrated the dynamic support levels of 21 periods EMA and the 9 periods EMA downside and the coin is trading below the two EMAs which connotes the gradual increase of the bears’ momentum. The Relative Strength Index period 14 is at 50 levels with the signal lines pointing up to indicate a buy signal which may be a pullback. An increase in the sellers’ pressure may push the price below the support level of $36 and the daily candlestick may close below the level, the price will decline further to test the $31 and $27 support level. Inability to break down the support level of $36, the bullish trend may continue to target the resistance levels at $41, $44, and $48.
BNBUSD medium-term Trend: Bearish
The bulls’ momentum is gradually increasing in the BNBUSD market and the bears’ pressure is decreasing in the 4-hour chart. Last week. The coin tested the support level of $36 at the early stage of today’s market. A pin bar candle pattern is formed and the price started increasing towards the $41 price level.
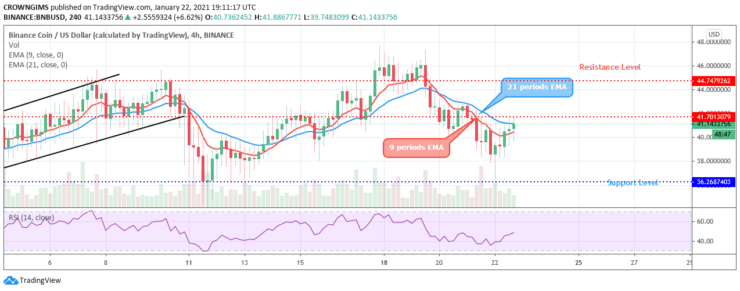
The 9 periods EMA is trying to cross the 21 periods EMA upside while the coin is trading above the two EMAs which connotes an increase in the bulls’ momentum. The RSI indicator period 14 is above 40 levels and the signal lines bending up to indicate a buy signal.
- Broker
- Min Deposit
- Score
- Visit Broker

- Award-winning Cryptocurrency trading platform
- $100 minimum deposit,
- FCA & Cysec regulated

- 20% welcome bonus of upto $10,000
- Minimum deposit $100
- Verify your account before the bonus is credited
- Fund Moneta Markets account with a minimum of $250
- Opt in using the form to claim your 50% deposit bonus
Learn to Trade
Never Miss A Trade Again

Signal Notification
Real-time signal notifications whenever a signal is opened, closes or Updated

Get Alerts
Immediate alerts to your email and mobile phone.

Entry Price Levels
Entry price level for every signal Just choose one of our Top Brokers in the list above to get all this free.