

BNBUSD Price Analysis – April 01
The price has increased to the $448 level and when the daily candle closes above it, the price may increase to $516, and may expose the price to the $581 resistance level. In case there is an opposition by the bears at the resistance level of $448, the price may decrease towards the support levels of $382, $329 and $256
BNB/USD Market
Key levels:
Supply levels: $448, $516, $581
Demand levels: $398, $329, $256
BNBUSD Long-term Trend: Bullish
BNBUSD is on the bullish movement in the long-term outlook. The bullish breakout at the resistance level of $398 has pushed the price to test the resistance level of $448. The crypto was on the ranging mode within $329 and $398 levels before the breakout. The price broke up the resistance level of $398 on March 22. The price increases and tests the resistance level of $448 at present time.
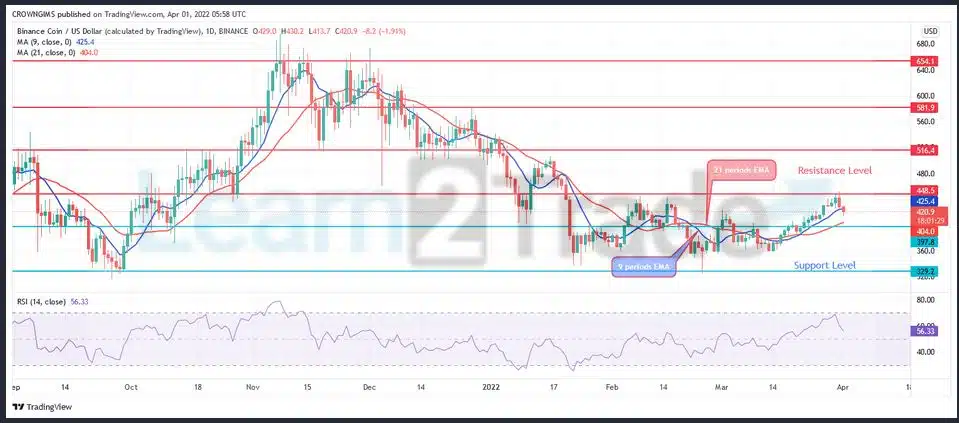
The fast moving average has crossed the slow moving average upside. The price is trading above the 9 periods EMA and the 21 periods EMA at close contact as an indication of low bullish movement. The price has increased to the $448 level and when the daily candle closes above it, the price may increase to $516, and may expose the price to the $581 resistance level. In case there is an opposition by the bears at the resistance level of $448, the price may decrease towards the support levels of $382, $329 and $256. The relative strength index period 14 is at 57 levels pointing downside to indicate sell signal.
BNBUSD medium-term Trend: Bearish
The Binance Coin is on the bearish movement in the 4-hour chart. The coin was under the control of the bulls last week. The bullish momentum increases and the price increased accordingly to the resistance level of $448. The just mentioned level was defended by the bears. The price is currently pulling back towards the support level of $398.

The 9 periods EMA is trying to cross the 21 periods EMA downside to establish a bearish movement. Meanwhile, the price is trading below the two EMAs as an indication of bearish movement. The Relative Strength Index period 14 is at 46 levels displaying a bearsh direction.
You can purchase Lucky Block here. Buy LBlock:


