Don’t invest unless you’re prepared to lose all the money you invest. This is a high-risk investment and you are unlikely to be protected if something goes wrong. Take 2 minutes to learn more
Bitget Token Price Forecast: March 17
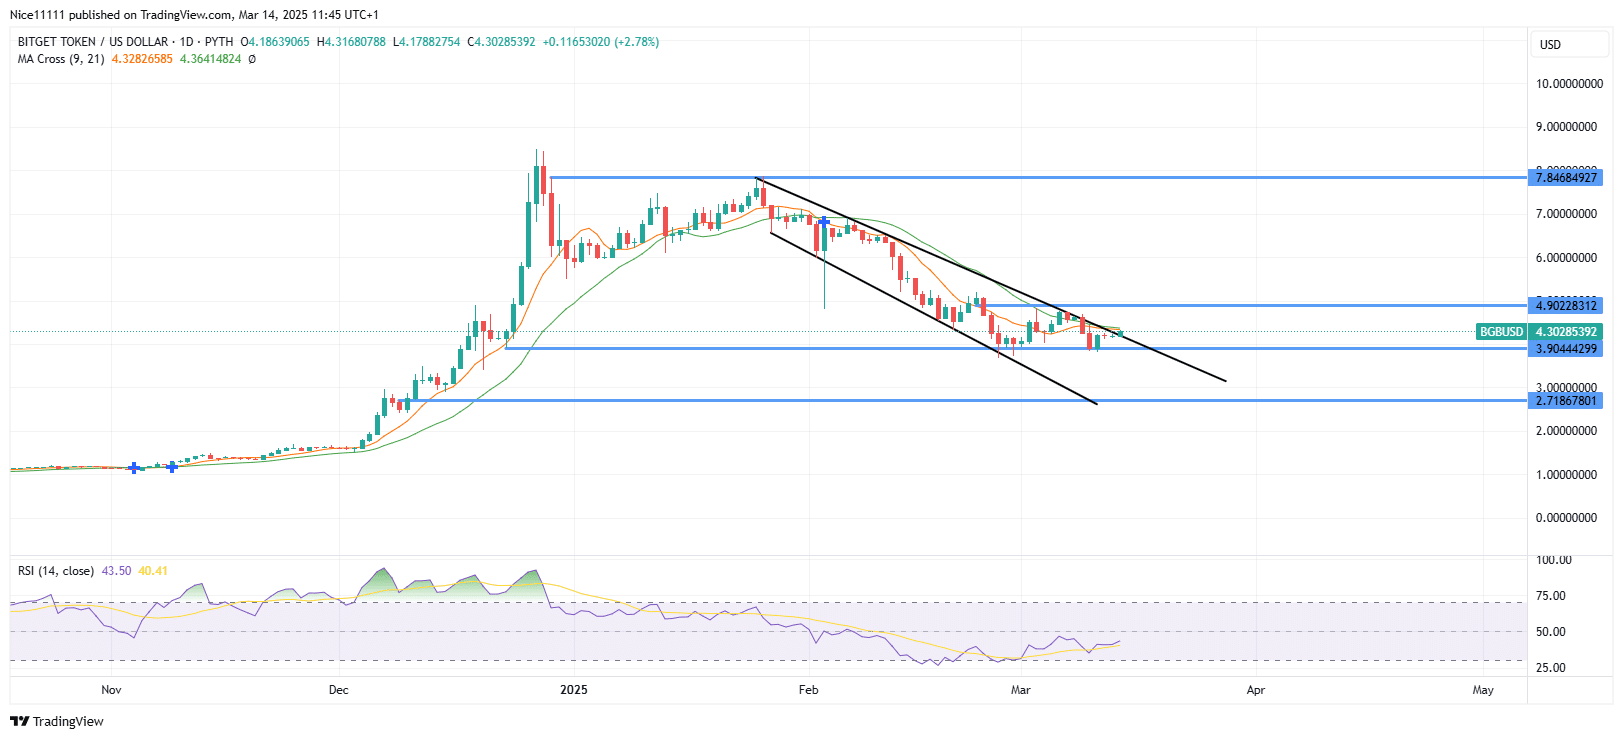
Biget Token commenced the year in a consolidation phase, characterized by a narrow trading range. The 9-period Moving Average provided support until January, when the 21-period Moving Average converged, signalling a reversal. Throughout this period, the Relative Strength Index (RSI) indicated an overbought market, suggesting that the bulls were losing momentum. The bulls’ failure to sustain upward momentum led to a change in market direction.
In early February, the 9-period Moving Average crossed below the 21-period Moving Average, confirming a bearish trend. Concurrently, the RSI slope had already transitioned into a bearish trajectory, departing from the overbought region and signaling a downtrend. The daily candles subsequently repositioned below the Moving Averages, revealing the ongoing decline.
Biget Token Forecast: BGBUSD Outlook
The price has declined into the significant bullish order block at $3.90, resulting in the formation of a double bottom pattern. However, the pattern remains unconfirmed until a breakout above the neckline occurs. A breach of the $3.90 support level is expected to precipitate a price decline to $2.70. Conversely, a successful breakout above the neckline could invalidate bearish crypto signals and pave the way for a potential reversal.
BGB Medium-Term Trend: Ranging
On the 4-hour timeframe, a descending triangle pattern is evident. This formation typically suggests a bearish bias, but a breakout in either direction will provide insight into the market’s next direction. Currently, sellers maintain dominance, but a breakout above the triangle’s resistance could shift the balance in favor of the bulls.
Note: Learn2.trade is not a financial advisor. Do your research before investing your funds in any financial asset, product, or event. We are not responsible for your investment results.
Trade on MT4 with Leverage up to 1:500! Trade on MT4 with Leverage up to 1:500!
X
We use cookies to ensure that we give you the best experience on our website. If you continue to use this site we will assume that you are happy with it.

 BGB Medium-Term Trend: Ranging
 BGB Medium-Term Trend: Ranging


