ADA Price Analysis – February 23
The price may increase to $1.23 – $1.31 should the bulls gain more momentum and the daily candle closes above the $1.11 level. In case the bears defend the $1.11 level, the bears’ pressure may likely reduce the price.
ADA/USD Market
Key Levels:
Resistance levels: $1.11, $1.23, $1.31
Support levels: $0.98, $0.83, $0.73
ADA/USD Long-term Trend: Bullish
ADA/USD was exhibiting a range-bound movement within the $0.38 and $0.43 price level till February 03. The buyers gathered enough momentum to break up the resistance level of $0.43 on February 06; this is seen on the daily chart with the formation of strong bullish candles. The resistance level of $0.73, $0.83, and $0.98 were penetrated upside by the bulls’ pressure. It is currently pulling back from the resistance level of $1.11.
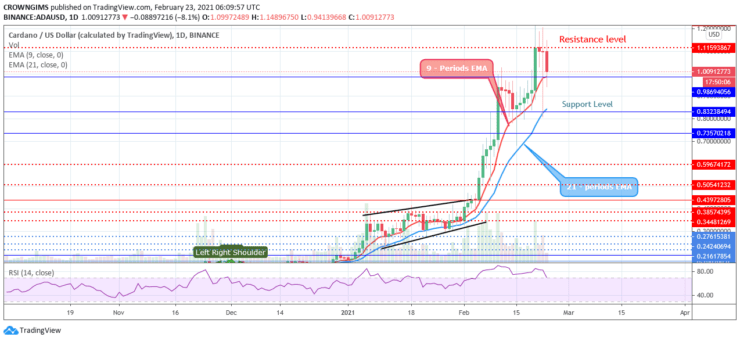
ADA/USD may increase to $1.23 – $1.31 should the buyers gain more momentum and the daily candle closes above the $1.11 level. In case the sellers defend the $1.11 level, the bear pressure may likely reduce the price. However, the next support levels can be found at $0.98, $0.83, and $0.73. The technical indicator RSI is at 70 levels with the signal line pointing downside which indicates a bearish signal.
ADA/USD Medium-term Trend: Bearish
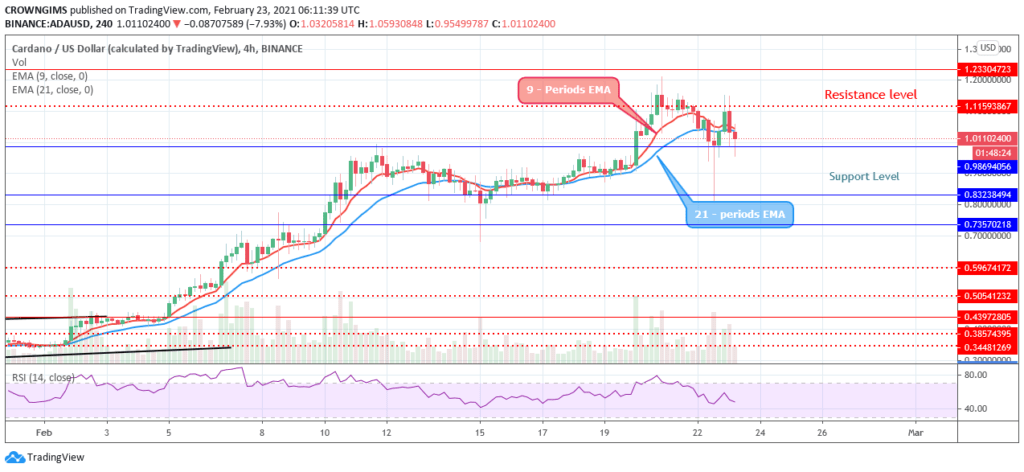
Cardano is under the pressure of the sellers in the 4-hour chart. The crypto was range-bound within the resistance level at $0.98 and the support level at $0.83 last two weeks; this scenario commenced on February 12 when the coin tested the resistance level of $0.98 and the level hold the price. Attempts were made by the bears and the bulls to break down the support level of $0.83 and resistance level of $0.98 respectively but the bulls prevailed on February 20 to test the $1.23 level.

The bulls’ pressure is getting weak and bears are dominating with the price trading below the 9 periods EMA and 21 periods EMA as a sign of bearish movement while the relative strength index period 14 is at 50 levels and the signal line showing a bearish signal.
.