S&P 500 Price Analysis – February 15
Should the bears penetrate the support level of $4364, S&P 500 will decline to $4276 and $4196 levels. In case the bulls gain more pressure and break up $4476 resistance level, then, $45938 and $4723 may be tested
S&P 500 Market
Key levels:
Resistance levels: $4476, $4593, $4723
Support levels: $4364, $4276, $4196
S&P 500 Long-term trend: Bearish
On the daily chart S&P 500 is bearish. The price could not continue to obey the bulls’ command when it reached the resistance level of $4593. It tested the mentioned level two times with the hope of breaking up the mentioned level. The bears interrupts the bullish movement with the formation of bearish engulfing candle. The price breaks down the support level of $4476. At the moment, the price is pulling back.
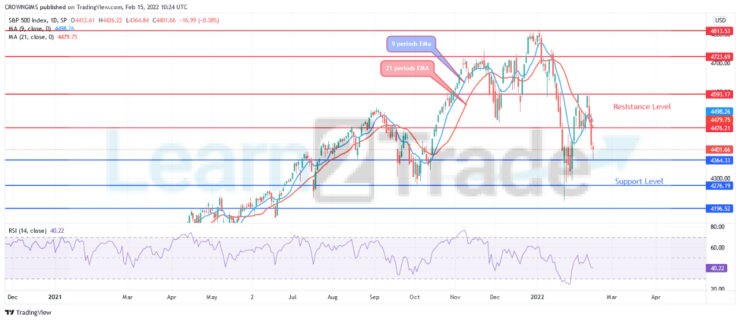
S&P 500 is trading below the 9 periods EMA and the 21 periods EMA at distance which indicate that bears’ pressure is increasing in the S&P 500 market. The relative strength index period 14 is at 40 levels with the signal lines pointing down to indicate sell signal. Should the bears penetrate the support level of $4364, S&P 500 will decline to $4276 and $4196 levels. In case the bulls gain more pressure and break up $4476 resistance level, then, $45938 and $4723 may be tested.
S&P 500 Medium-term Trend: Bearish
S&P 500 is on the bearish movement on the 4-hour chart outlook. The price action tested the resistance level of $4593 twice. The first time was on 02 February and the second time was last week, (February 10). It is an indication that bears will take over the market. Indeed, price falls to support level of $4364.
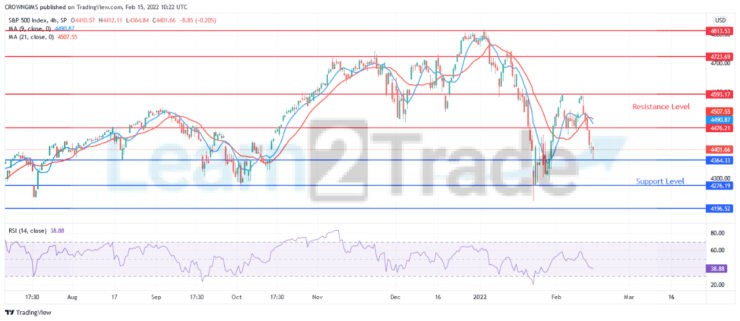
The price is trading below the 9 periods EMA and 21 periods EMA as an indication of bearish movement. The relative strength index period 14 is at 38 levels displaying sell signal.
- Broker
- Min Deposit
- Score
- Visit Broker

- Award-winning Cryptocurrency trading platform
- $100 minimum deposit,
- FCA & Cysec regulated

- 20% welcome bonus of upto $10,000
- Minimum deposit $100
- Verify your account before the bonus is credited
- Fund Moneta Markets account with a minimum of $250
- Opt in using the form to claim your 50% deposit bonus
Learn to Trade
Never Miss A Trade Again

Signal Notification
Real-time signal notifications whenever a signal is opened, closes or Updated

Get Alerts
Immediate alerts to your email and mobile phone.

Entry Price Levels
Entry price level for every signal Just choose one of our Top Brokers in the list above to get all this free.