S&P 500 Price Analysis – March 08
In case the bears push down the price to penetrate the support level of $4169, S&P 500 will decline to $4060 and $3964 levels. In case the bulls oppose the bears at $4169 level, price may pullback and face resistance levels at $4231, $4320 and $4405 levels.
S&P 500 Market
Key levels:
Resistance levels: $4231, $4320, $4405
Support levels: $4169, $4060, $3964
S&P 500 Long-term trend: Bearish
On the weekly chart, S&P 500 is bearish. Bears continue to dominate the S&P 500 market since four weeks ago. The price pulled back and retest the resistance level of $4405 last week. Bearish force increases and the price reduces accordingly. The price has broken down the support levels of $4320 and $4231 levels. The price is currently approaching the support level of $4169. Further price declination envisaged.
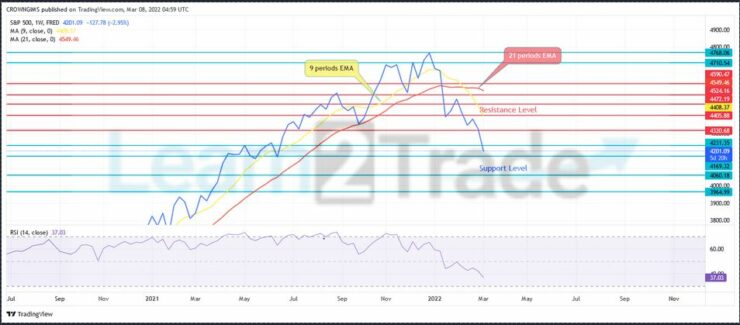
S&P 500 is trading below the 9 periods EMA and the 21 periods EMA which indicate a strong bearish trend in the S&P 500 market. The relative strength index period 14 is at 37 levels with the signal lines pointing down to indicate sell signal. In case the bears push down the price to penetrate the support level of $4169, S&P 500 will decline to $4060 and $3964 levels. In case the bulls oppose the bears at $4169 level, price may pullback and face resistance levels at $4231, $4320 and $4405 levels.
S&P 500 Medium-term Trend: Bearish
S&P 500 is on the bearish trend on the daily chart outlook. The sellers exert more pressure and it makes bearish movement continue in the market. The price is still under the control of the double top chart pattern formed at the resistance level of $4393. The former support level of $4317 and $4201 has turned to resistance level.
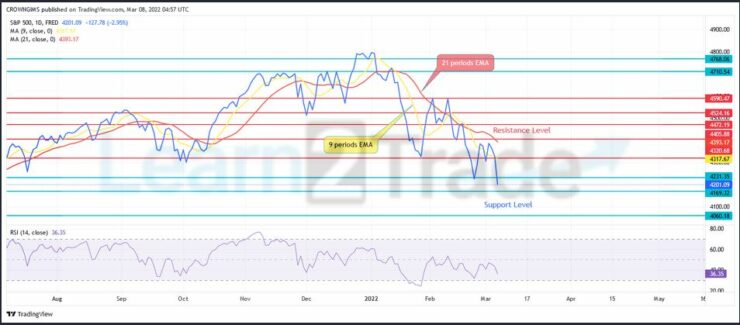
The price is trading below the 9 periods EMA and 21 periods EMA as an indication of bearish movement. The relative strength index period 14 is at 36 levels displaying sell signal.
You can purchase Lucky Block – Guide, Tips & Insights | Learn 2 Trade here. Buy LBlock:
- Broker
- Min Deposit
- Score
- Visit Broker

- Award-winning Cryptocurrency trading platform
- $100 minimum deposit,
- FCA & Cysec regulated

- 20% welcome bonus of upto $10,000
- Minimum deposit $100
- Verify your account before the bonus is credited
- Fund Moneta Markets account with a minimum of $250
- Opt in using the form to claim your 50% deposit bonus
Learn to Trade
Never Miss A Trade Again

Signal Notification
Real-time signal notifications whenever a signal is opened, closes or Updated

Get Alerts
Immediate alerts to your email and mobile phone.

Entry Price Levels
Entry price level for every signal Just choose one of our Top Brokers in the list above to get all this free.