Don’t invest unless you’re prepared to lose all the money you invest. This is a high-risk investment and you are unlikely to be protected if something goes wrong. Take 2 minutes to learn more
AVAXUSD Price Forecast: June 13th
The AVAXUSD price forecast shows that the crypto price has faced a bearish pullback. However, the buyers remain determined to reclaim the $34.250 key level.
AVAXUSD Long Term Trend: Bullish (1-Day Chart)
Key Levels
Resistance Levels: $40.000, $44.000
Support Levels: $34.250, $30.890
AVAXUSD Price Forecast: Avalanche Outlook
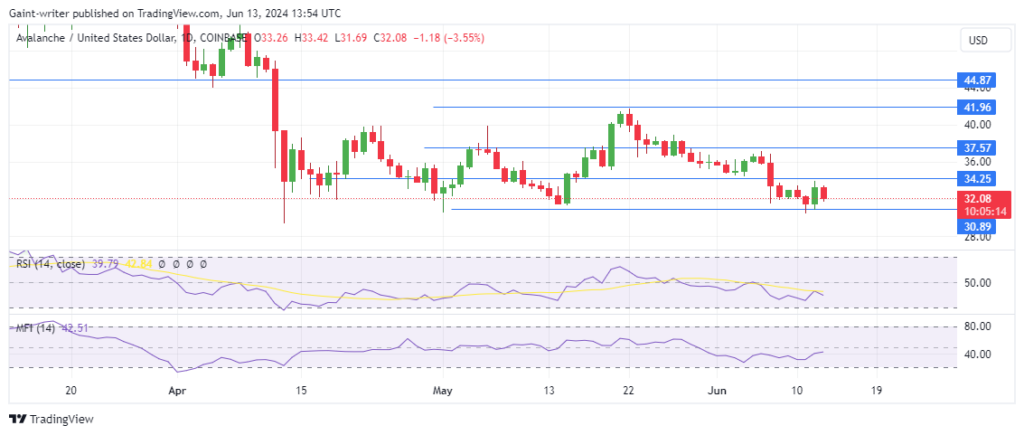
The daily chart shows that the AVAXUSD price has been descending from the $42.000 key zone since last month. The bears managed to put the buyers under their control despite their struggle. The buyers, at every opportunity, have been seen fighting back, but their efforts have been met with resistance.
In June, the sell-side traders successfully broke through the market structure at the $34.250 significant level. They further extended their reach down to the $30.000 supply level before pulling out. The buyers, in an attempt to cross back above, have been pushed out once again, as the crypto sellers are now aiming to retest the $30.000 key level.
A test at this key level could provide an opportunity for the buyers to make another entry. This can potentially set the stage for a stronger bullish response. The Relative Strength Index (RSI) on the daily chart reveals that the buyers are still in control. The Money Flow Index is below the midline, suggesting the current price direction.
AVAXUSD Medium-Term Trend: Bullish (4-hour chart)
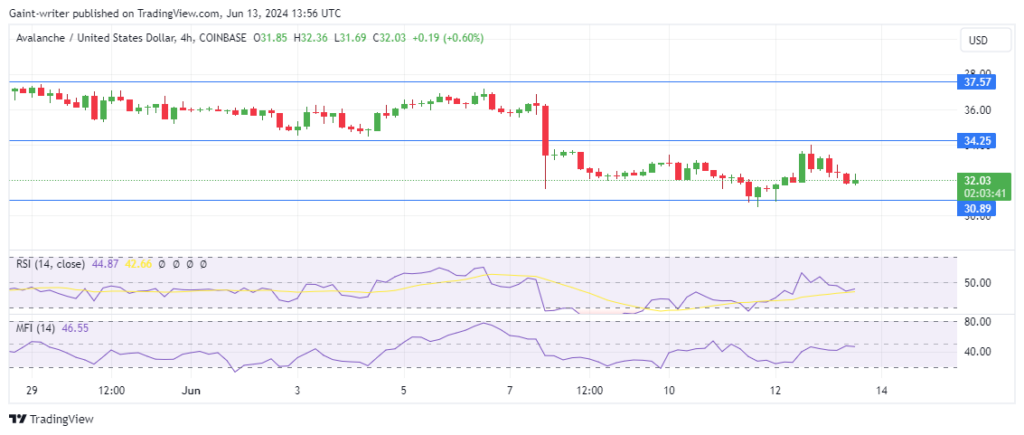
On the 4-hour chart, the buyers are showing less timidity, and they are very likely to fight back. Their current action is attempting to pull the price up towards the $34.000 market area.
How To Buy Lucky Block – Guide, Tips & Insights | Learn 2 Trade
Note: Learn2.trade is not a financial advisor. Do your research before investing your funds in any financial asset, product, or event. We are not responsible for your investment results.
- Broker
- Min Deposit
- Score
- Visit Broker
- Award-winning Cryptocurrency trading platform
- $100 minimum deposit,
- FCA & Cysec regulated
- 20% welcome bonus of upto $10,000
- Minimum deposit $100
- Verify your account before the bonus is credited
- Fund Moneta Markets account with a minimum of $250
- Opt in using the form to claim your 50% deposit bonus
Learn to Trade
Never Miss A Trade Again

Signal Notification
Real-time signal notifications whenever a signal is opened, closes or Updated

Get Alerts
Immediate alerts to your email and mobile phone.

Entry Price Levels
Entry price level for every signal Just choose one of our Top Brokers in the list above to get all this free.


