

Avalanche Price Forecast: August 24
The Avalanche price forecast is for a market largely lacking direction to be gradually tilting towards buyers and could rise above $10.60.
Avalanche Long-Term Trend: Bullish (1-Day Chart)
Key Levels:
Zones of supply: $14.20, $21.50, $10.60
Zones of Demand: $9.50, $8.0, $7.00

The Avalanche market currently lacks direction as buyers struggle to recover the price back to $12.30. The coin was already struggling to overcome the $13.40 resistance level when it was hit by a strong bearish wave. This effectively knocked the buyers out and plunged the coin below the $10.60 support level, where the price rose. Currently, the bears have become exhausted, but the buyers themselves are too weak to take the initiative, leaving the coin in limbo just above $9.50.
Avalanche Price Forecast: AVAX/USD Outlook
The Avalanche (AVAXUSD) market currently finds itself in a state of uncertainty and lacking clear direction as buyers grapple with the challenge of reclaiming the price level of $12.30.
Before this, the coin had been attempting to overcome the $13.40 resistance. Its efforts were met with a bearish wave, which disrupted the buying momentum, causing the coin to plummet below $10.60, from which it had previously rebounded.
Presently, the bears seem to have exhausted their selling pressure, yet the buyers are struggling to assert control, resulting in a market that remains in a state of ambiguity just above the $9.50 mark.
AVAX/USD Medium-Term Trend: Bullish (4-hour chart)
Analyzing the daily chart, it’s evident that the Stochastic Oscillator lines are oscillating near the oversold boundary, indicating a degree of market uncertainty. Additionally, the EFI (Elders Force Index) power line exhibits a slight inclination towards the bears by being below the zero level. This reflects the impact of their downward push on the market.
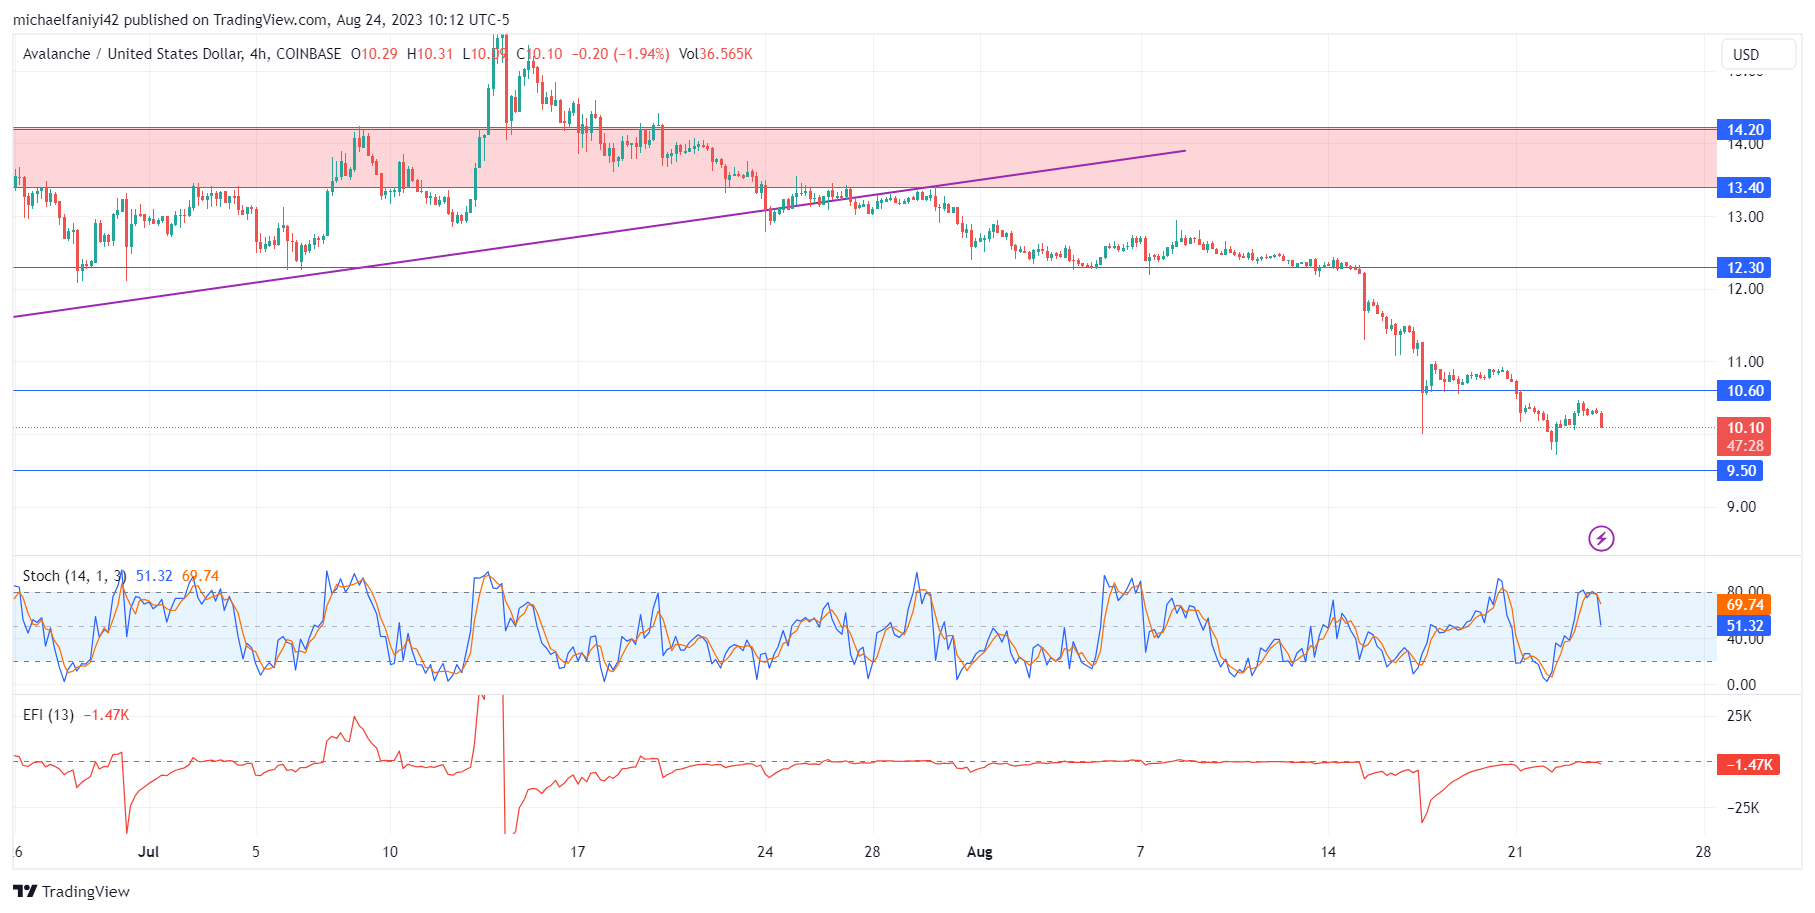
Transitioning to the 4-hour timeframe, the EFI has moved closer to equilibrium, signifying a potential shift in favor of the bulls within this shorter timeframe. Concurrently, the Stochastic indicator has surprisingly ascended towards overbought territory, implying a gradual resurgence of bullish activity. If this upward trend continues, there’s a possibility that the bulls could gather momentum to elevate the coin’s price above the crucial $10.60 level.
How To Buy Lucky Block – Guide, Tips & Insights | Learn 2 Trade
Note: Learn2.trade is not a financial advisor. Do your research before investing your funds in any financial asset or presented product or event. We are not responsible for your investing results.
- Broker
- Min Deposit
- Score
- Visit Broker

- Award-winning Cryptocurrency trading platform
- $100 minimum deposit,
- FCA & Cysec regulated

- 20% welcome bonus of upto $10,000
- Minimum deposit $100
- Verify your account before the bonus is credited


- Fund Moneta Markets account with a minimum of $250
- Opt in using the form to claim your 50% deposit bonus


