Don’t invest unless you’re prepared to lose all the money you invest. This is a high-risk investment and you are unlikely to be protected if something goes wrong. Take 2 minutes to learn more
Avalanche Price Forecast – September 26th
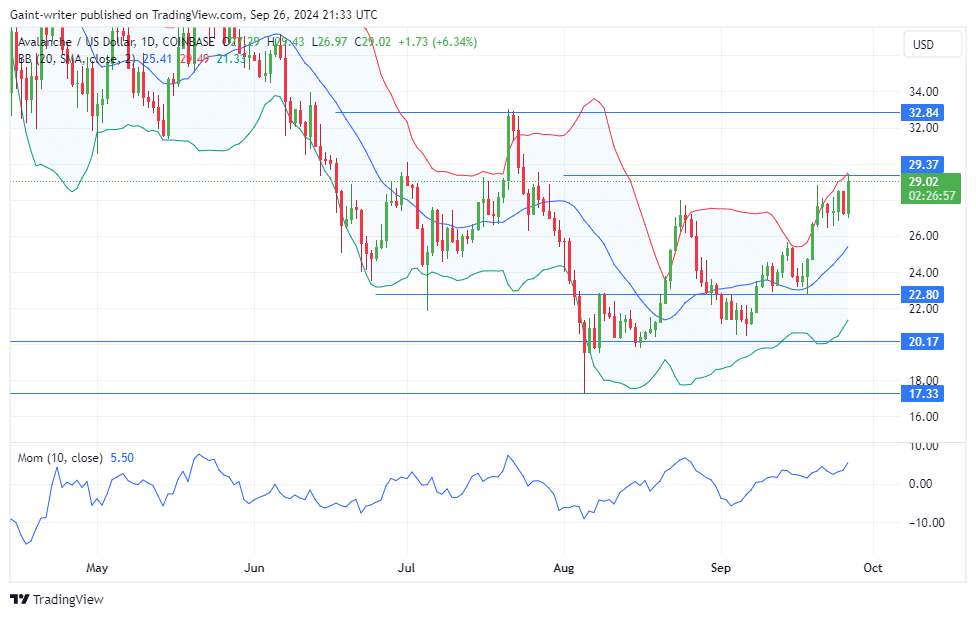
The Avalanche price forecast highlights strong bullish momentum as buyers strive for a breakthrough toward the key level of $30.00.
AVAXUSD Long Term Trend: Bullish (1-Day Chart)
Key Levels
Support Levels: $20.150, $25.000
Resistance Levels: $30.000, $35.000 
Avalanche Price Forecast: AVAXUSD Outlook
The Bollinger Bands indicate increased volatility, with the price fluctuating within a broad range. The rebound from the middle band has provided buyers with additional strength, suggesting a potential continuation of the bullish trend.
The current outlook for AVAXUSD market shows that buyers are in a favorable position to challenge the $30.000 key resistance level. The Bollinger Bands hint at a possible breakout following a period of consolidation and tightening in the market. Buyers’ sustained pressure has kept sellers at bay, and if this trend continues, a move beyond $30.000 could be on the horizon.
The Momentum indicator aligns with this bullish outlook, as it has been pointing upward, reflecting ongoing buying strength. Despite a minor slowdown in momentum on the short-term time frame, the overall trend remains bullish, with buyers appearing ready for another upward move.
Avalanche Medium Term Trend: Bullish (4-hour Chart)
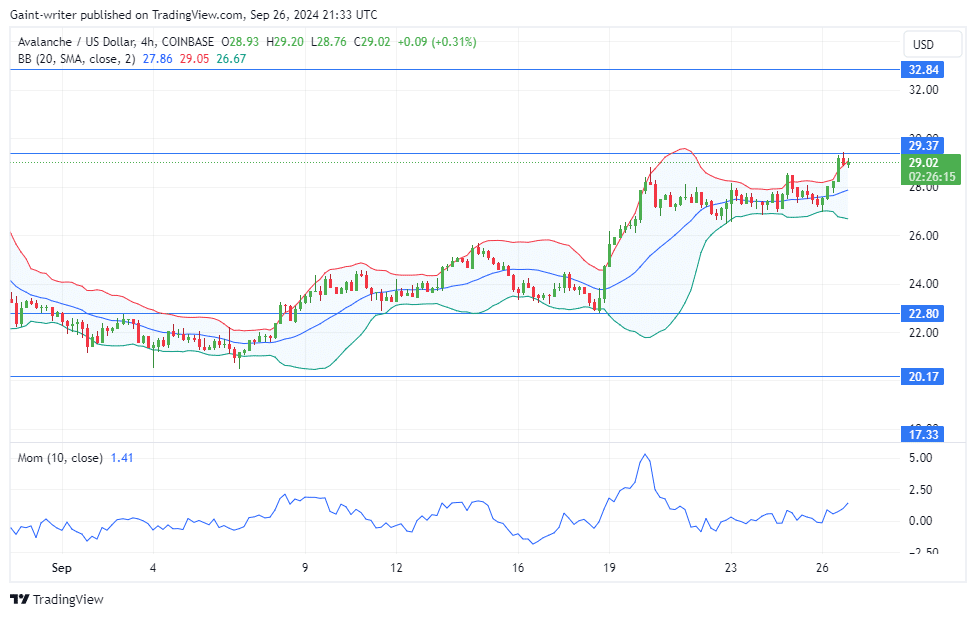
In the short term, there has been a slight drop in momentum, allowing sellers to attempt a brief comeback. However, this pullback is seen as temporary, with the broader market still poised for higher prices. The Bollinger Bands on the 4-hour chart show signs of a potential breakout, as the price has tested the upper band, indicating increased volatility.
Make money without lifting your fingers: Start using a world-class auto trading solution
How To Buy Lucky Block – Guide, Tips & Insights | Learn 2 Trade
Note: Learn2.trade is not a financial advisor. Do your research before investing your funds in any financial asset, product, or event. We are not responsible for your investment results.
- Broker
- Min Deposit
- Score
- Visit Broker
- Award-winning Cryptocurrency trading platform
- $100 minimum deposit,
- FCA & Cysec regulated
- 20% welcome bonus of upto $10,000
- Minimum deposit $100
- Verify your account before the bonus is credited
- Fund Moneta Markets account with a minimum of $250
- Opt in using the form to claim your 50% deposit bonus
Learn to Trade
Never Miss A Trade Again

Signal Notification
Real-time signal notifications whenever a signal is opened, closes or Updated

Get Alerts
Immediate alerts to your email and mobile phone.

Entry Price Levels
Entry price level for every signal Just choose one of our Top Brokers in the list above to get all this free.


