Don’t invest unless you’re prepared to lose all the money you invest. This is a high-risk investment and you are unlikely to be protected if something goes wrong. Take 2 minutes to learn more
Avalanche Price Forecast – November 28
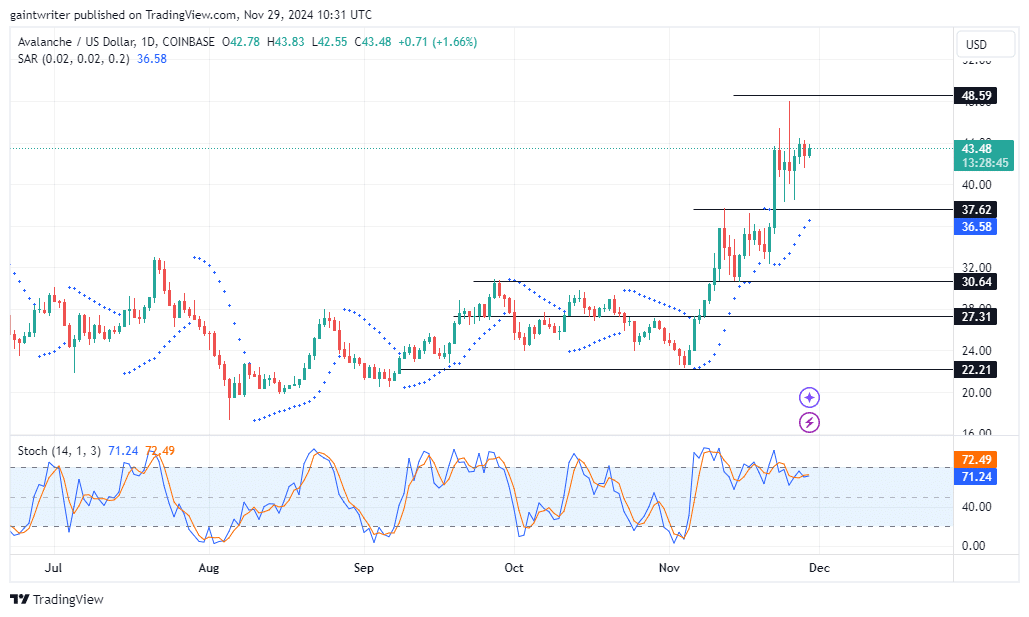
The Avalanche price forecast highlights a decrease in bullish momentum despite a recent upward run.
Avalanche Long-Term Trend: Bullish (Daily Chart)
Support Levels: $30.640, $22.210
Resistance Levels: $37.420, $40.000
Avalanche Price Forecast – AVAXUSD Outlook
Avalanche’s price continues to maintain a bullish structure. Earlier this month, the rally from the $22.210 bullish order block confirmed institutional accumulation at lower levels, driving upward expansion. However, the $40.000 resistance zone coincides with a critical liquidity pool, where the price is now consolidating.
The rejection around $40.000 signals the presence of sell-side liquidity, prompting a retracement as the market gathers strength. Current price action suggests that liquidity beneath the $37.420 resistance zone is being engineered, setting the stage for a potential breakout.
The Parabolic SAR indicates waning bullish momentum as it flips above the price, signaling consolidation without negating the overall bullish trend. The Stochastic Oscillator entering overbought conditions hints at potential exhaustion but aligns with typical pullbacks in a bullish market. This suggests that buyers may regroup for another push higher, aided by favorable crypto signals.
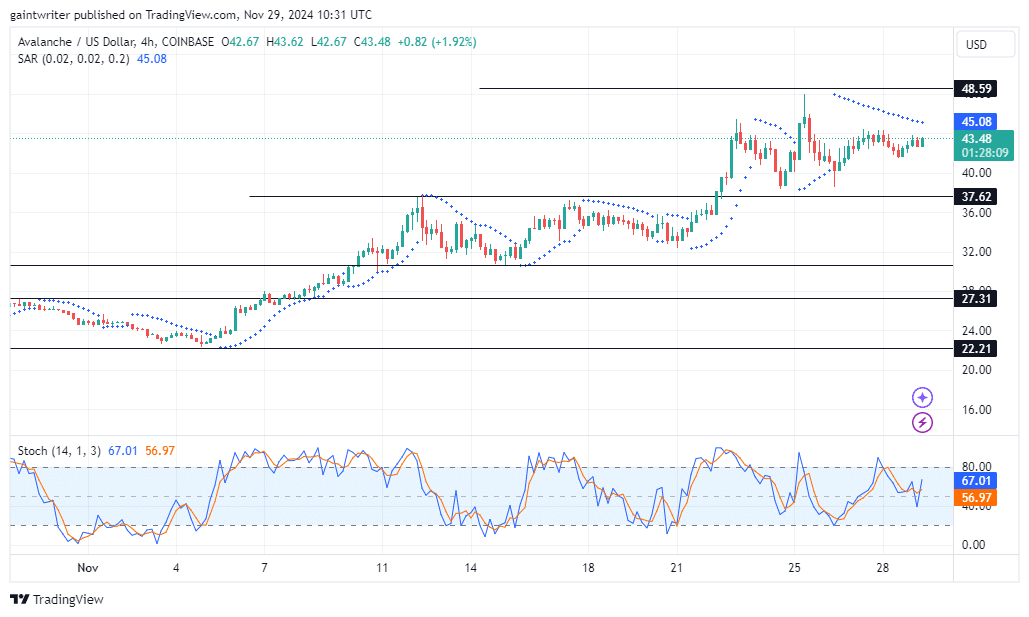
Avalanche Medium-Term Trend: Bullish (4-hour)
On the 4-hour chart, Avalanche shows signs of consolidation. The price remains range-bound near $37.420, with multiple failed attempts to break through resistance. This behavior likely reflects a phase of liquidity accumulation before the next significant move.
Make money without lifting your fingers: Start using a world-class auto trading solution
How To Buy Lucky Block – Guide, Tips & Insights | Learn 2 Trade
Note: Learn2.trade is not a financial advisor. Do your research before investing your funds in any financial asset, product, or event. We are not responsible for your investment results.
- Broker
- Min Deposit
- Score
- Visit Broker
- Award-winning Cryptocurrency trading platform
- $100 minimum deposit,
- FCA & Cysec regulated
- 20% welcome bonus of upto $10,000
- Minimum deposit $100
- Verify your account before the bonus is credited
- Fund Moneta Markets account with a minimum of $250
- Opt in using the form to claim your 50% deposit bonus
Learn to Trade
Never Miss A Trade Again

Signal Notification
Real-time signal notifications whenever a signal is opened, closes or Updated

Get Alerts
Immediate alerts to your email and mobile phone.

Entry Price Levels
Entry price level for every signal Just choose one of our Top Brokers in the list above to get all this free.


