Key Resistance Zones: 7000, 7100, 7200
Key Support Zones: 6100, 6000, 5900
Australia 200 (AU200AUD) Long-term Trend: Ranging
The index is still fluctuating between levels 5750 and 6250. The price has been consolidating near the resistance line without breaking the key level. The price has tested the resistance line as the index continued its range-bound movement below level 6250.
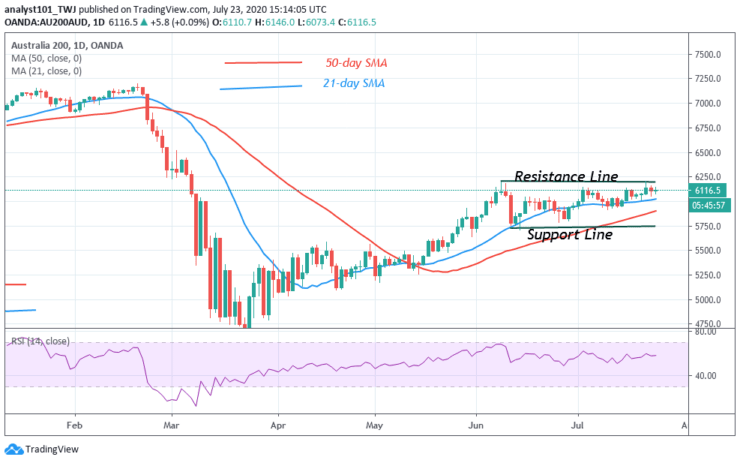
Daily Chart Indicators Reading:
The 21-day SMA crosses over the 50-day SMA indicating an uptrend. Presently, the SMAs are sloping upward indicating the previous uptrend. The index has fallen to level 58 of the Relative Strength Index period 14. This indicates that the market is in the uptrend zone.
Australia 200 (AU200AUD) Medium-term Trend: Ranging
On the 4- hour chart, the index is range-bound between levels 5700 and 6200. The price has not broken any of the key levels. It is gradually rising to level 6200. The market will resume a downward move when resisted at the upper price range. In the meantime, price has been consolidating in the middle of the price range.
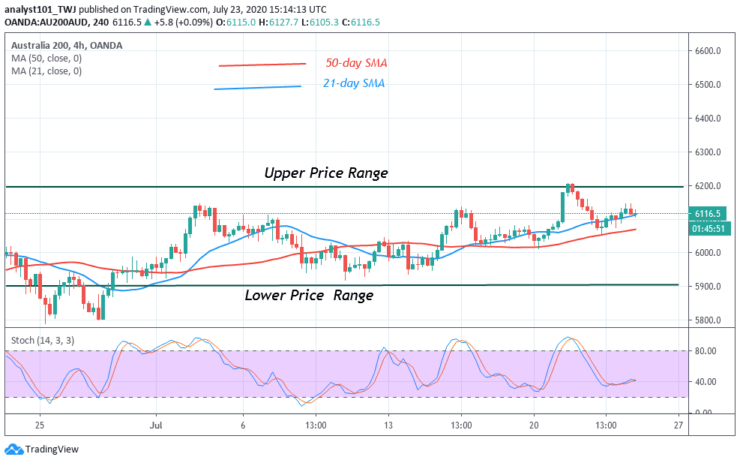
4-hour Chart Indicators Reading
AU200AUD is about 40% range of the daily stochastic. It indicates a bullish momentum. The 21-day SMA and the 50-day SMA are sloping horizontally as the market continues its sideways movement.
General Outlook for Australia 200 (AU200AUD)
Australia 200 is still fluctuating in the middle of the price range. The index is yet to trend as it continues to consolidate above level 6000. This has been the market scenario since June.
Note: Learn2.Trade is not a financial advisor. Do your research before investing your funds in any financial asset or presented product or event. We are not responsible for your investing results
- Broker
- Min Deposit
- Score
- Visit Broker

- Award-winning Cryptocurrency trading platform
- $100 minimum deposit,
- FCA & Cysec regulated

- 20% welcome bonus of upto $10,000
- Minimum deposit $100
- Verify your account before the bonus is credited
- Fund Moneta Markets account with a minimum of $250
- Opt in using the form to claim your 50% deposit bonus
Learn to Trade
Never Miss A Trade Again

Signal Notification
Real-time signal notifications whenever a signal is opened, closes or Updated

Get Alerts
Immediate alerts to your email and mobile phone.

Entry Price Levels
Entry price level for every signal Just choose one of our Top Brokers in the list above to get all this free.