

Over the past week, broader market sentiment across stocks and futures has been mildly bearish—a trend that’s clearly reflected in the Australia 200 (ASX 200) index. This negative sentiment has stalled upward momentum and placed the market in a precarious position. If bearish pressure persists, there’s a risk that the current support level could be breached, potentially triggering a more significant price decline.
Key Price Levels
Resistance: 9,000, 9,500, 10,000
Support: 8,000, 7,500, 7,000
ASX 200 on the Edge as Market Awaits a Catalyst
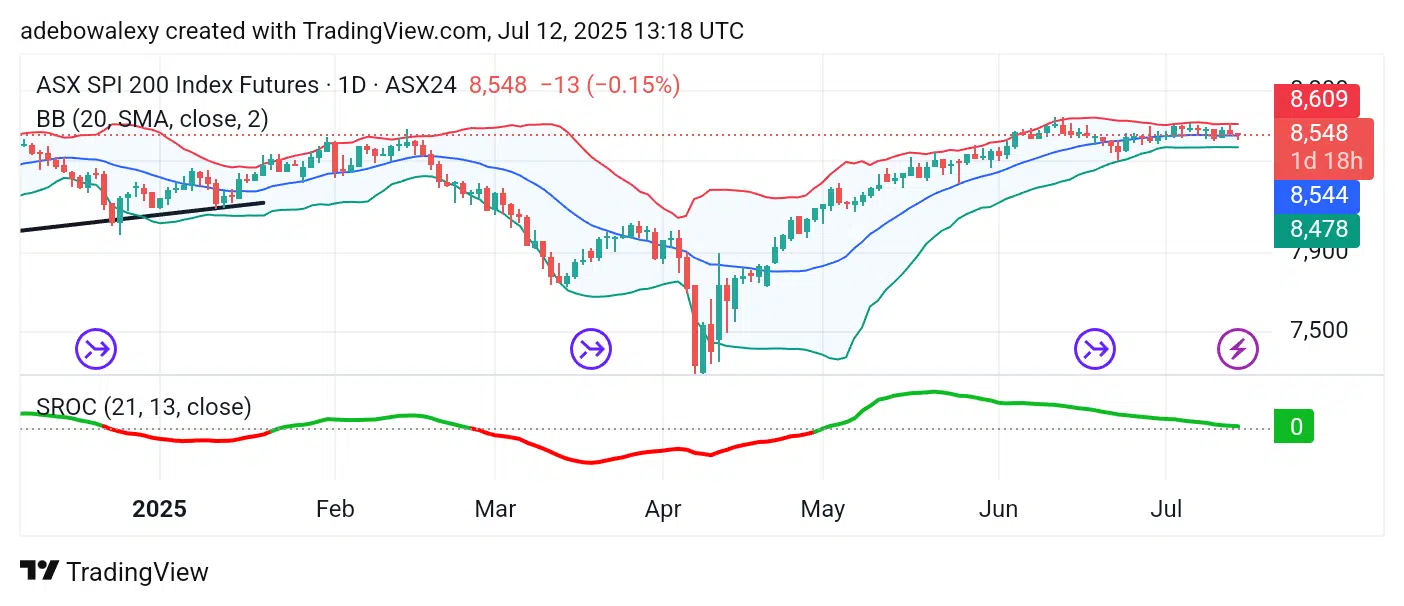
On the daily chart, the current price candle in the Australia 200 market sits just above the middle band of the Bollinger Bands (BB) indicator. Although the candle is bearish, it still holds the market above the 8,500 level. The BB indicator remains tightly contracted, which often precedes a strong move in either direction.
Meanwhile, the Smoothed Rate of Change (SROC) indicator line is still above the equilibrium level, though it is trending downward. This setup indicates market indecision and suggests that a stronger move—either upward or downward—may be imminent. The market appears to be approaching a critical moment: will it withstand bearish pressure or break below the middle BB band?

ASX 200’s Upside Appears Capped
While long-term traders remain hopeful for a breakout on the daily chart, the ASX 200 currently reflects a more cautious outlook. Price action has recently rebounded from the lower band of the BB indicator, but the latest candle is bearish, indicating rejection at higher levels. This suggests that the 8,567 resistance level may be facing downward pressure, requiring a stronger catalyst for a breakout.
The SROC indicator has now slipped below the equilibrium line, reinforcing the short-term bearish narrative. However, traders should closely monitor economic developments, which could provide the momentum needed to push the index toward the 8,750 or even the 9,000 resistance levels.
Make money without lifting your fingers: Start trading smarter today


