

AUDUSD Price Analysis – February 02
The price reverses at the support level of $0.69 and the price is increasing to the resistance levels of $0.72, $0.73 and $0.74. Below the current price level are support levels $0.70, $0.69 and $0.68.
AUD/USD Market
Key levels:
Resistance levels: $0.72, $0.73, $0.74
Support levels: $0.70, $0.69, $0.68
AUDUSD Long-term trend: Bullish
On the daily chart, AUDUSD is on the bullish movement. The price found support at $0.69 on 28 January. The currency pair could not increase further after the breakout at $0.72 level. Initially, a bullish engulfing candle formed and bullish movement was triggered. The $0.72 price level was broken upside. The sellers interrupted the increase with the formation of a bearish engulfing candle and the price tested the support level of $0.69. A bullish engulfing candle pattern emerges as an indication that bulls are ready to take over the market. At the moment, price is increasing towards $0.72 level.
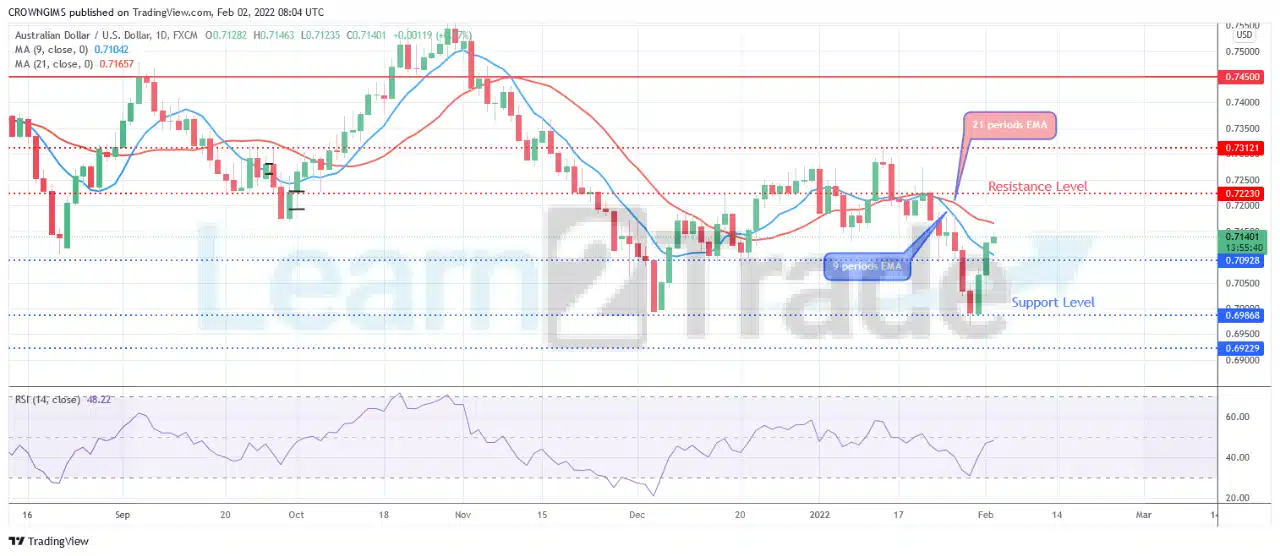
AUDUSD price is currently trading above the 9 periods EMA but below 21 periods EMA which indicate that bulls’ momentum is increasing. The relative strength index period 14 is at 50 levels and the signal lines pointing up displaying bullish direction. The price reverses at the support level of $0.69 and the price is increasing to the resistance levels of $0.72, $0.73 and $0.74. Below the current price level are support levels $0.70, $0.69 and $0.68.
AUDUSD medium-term Trend: Bullish
On the 4-hour chart, AUDUSD is bullish. Two weeks ago, the price was bearish towards the support level of $0.70 and support level of $0.69. The bears pushed the price down to the support level of $0.69. The bears’ pressure failed and the price reversed towards the resistance level of $0.70. The bulls’ pressure breaks up the mentioned level and it is heading towards $0.72 level.

AUDUSD is trading above the 9 periods EMA and 21 periods EMA. The relative strength index period 14 is above 60 levels and the signal lines pointing up to indicate a buy signal.


