AUDUSD Price Analysis – March 02
The bullish breakup of the $0.731 resistance level will push the price to $0.745, further bullish pressure increase will increase the price to $0.755 level. Below the current price level are support levels of $0.717, $0.710 and $0.698.
AUD/USD Market
Key levels:
Resistance levels: $0.731, $0.745, $0.755
Support levels: $0.717, $0.710, $0.698
AUDUSD Long-term trend: Bullish
On the daily chart, AUDUSD is bullish. The price action has formed a double bottom chart pattern on the daily chart. The currency pair firstly tested the support level of $0.710 on December 03. It pulled back to test the resistance level of $0.731, the just mentioned level holds and the bears pushed down the price to retest the previous low at $0.710 on January 28. The bulls are currently in charge of AUDUSD market.
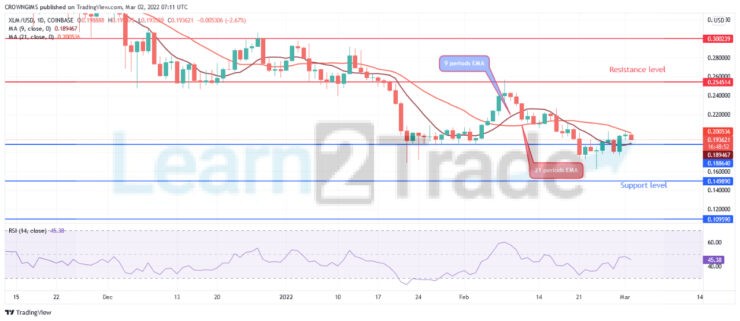
AUDUSD price is currently trading above the 9 periods EMA and 21 periods EMA which indicate that bulls’ momentum is increasing. The relative strength index period 14 is at 57 levels and the signal lines pointing up displaying bullish direction. The bullish breakup of the $0.731 resistance level will push the price to $0.745, further bullish pressure increase will increase the price to $0.755 level. Below the current price level are support levels of $0.717, $0.710 and $0.698.
AUDUSD medium-term Trend: Bullish
On the 4-hour chart, AUDUSD is bullish. The support level of $0.710 holds and the bullish movement was triggered at the support level of $0.698. The trend is increasing and $0.723 level is broken upside. The resistance level of $0.726 is tested. Further price increase envisaged.
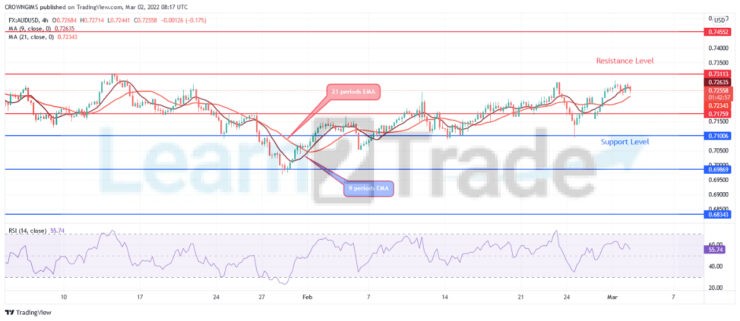
AUDUSD is trading above the 9 periods EMA and 21 periods EMA. The relative strength index period 14 is at 52 levels and the signal lines pointing down to indicate a sell signal which may be a pullback.
You can purchase Lucky Block – Guide, Tips & Insights | Learn 2 Trade here. Buy LBlock:
- Broker
- Min Deposit
- Score
- Visit Broker

- Award-winning Cryptocurrency trading platform
- $100 minimum deposit,
- FCA & Cysec regulated

- 20% welcome bonus of upto $10,000
- Minimum deposit $100
- Verify your account before the bonus is credited
- Fund Moneta Markets account with a minimum of $250
- Opt in using the form to claim your 50% deposit bonus
Learn to Trade
Never Miss A Trade Again

Signal Notification
Real-time signal notifications whenever a signal is opened, closes or Updated

Get Alerts
Immediate alerts to your email and mobile phone.

Entry Price Levels
Entry price level for every signal Just choose one of our Top Brokers in the list above to get all this free.