

Bears’ pressure increase in AUDUSD market
AUDUSD Price Analysis – 10 January
AUDUSD may drop to the support levels of $0.66, $0.65, and $0.64 if sellers can hold the $0.67 resistance level. Buyer fervor might lead price to tilt toward $0.68 and possibly even reach $0.69 if they can push above the resistance level of $0.67.
Key levels:
Resistance levels: $0.67, $0.68, $0.69
Support levels: $0.66, $0.65, $0.64
AUDUSD Long-term Trend: Bearish
The daily chart shows that the AUDUSD is declining. The currency pair started a bullish trend on November 14 when a strong bullish candle formed. The price increased to $0.65 as a result. Because there was not enough momentum in the selling, the buyers could move forward. When buying interest grew, the price broke through the $0.67 mark. On December 28, buyers eventually drove the price up to the $0.68 resistance level. Right now, the price is declining testing $0.66.
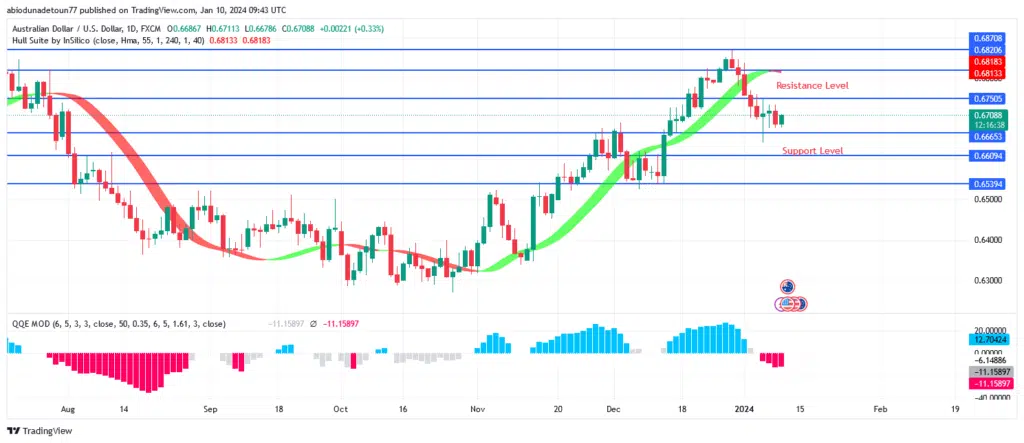
A negative market is indicated by the currency pair’s decline below the Hull Suite indicator. The QQE MOD indicator is below zero level with red histogram indicating sell signal. The price may drop to the support levels of $0.66, $0.65, and $0.64 if sellers can hold the $0.67 resistance level. Buyer fervor might lead the price to tilt toward $0.68 and possibly even reach $0.69 if they can push above the resistance level of $0.67.
AUDUSD medium-term Trend: Bearish
There is a downward trend visible on the 4-hour AUDUSD chart. For more than three weeks, the currency pair’s movement was constrained by the $0.65 support levels. A double bottom pattern appeared on the chart each time the price tested the expected support level at $0.65, suggesting a positive trend. The $0.66 barrier was broken by AUDUSD, and the $0.68 level was put to the test. Sellers defended the previously stated level, and the price began to decline.

AUDUSD market is most likely going to keep moving down. The QQE MOD is below zero level and the red histogram indicating a bearish movement.
You can purchase Lucky Block here. Buy LBLOCK


