The bullish breakup of the $0.71 resistance levels will push the price to $0.73, further bullish pressure increase will increase the price to $0.74 levels. Below the current price level are support levels of $0.70, $0.69 and $0.68
AUD/USD Market
Key levels:
Resistance levels: $0.71, $0.73, $0.74
Support levels: $0.70, $0.69, $0.68
AUDUSD Long-term trend: Bullish
On the daily chart, AUDUSD is commencing a bullish movement. The formation of a double bottom chart pattern on the daily chart indicate the beginning of bullish trend. The bearish momentum made the price to found support first at $0.69 on 03 December. The currency pair pulled back and tested $0.73 level. Bears pushed the price down second time and tested the $0.69 level on January 28. The currency pair could not decrease further. A bullish engulfing candle formed and bullish movement is triggered.
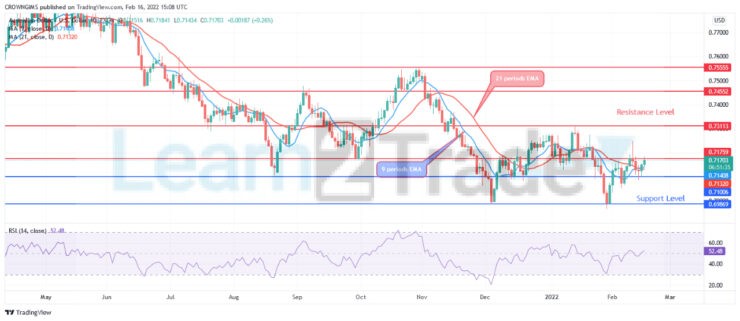
AUDUSD price is currently trading above the 9 periods EMA and 21 periods EMA which indicate that bulls’ momentum is increasing. The relative strength index period 14 is at 52 levels and the signal lines pointing up displaying bullish direction. The bullish breakup of the $0.71 resistance levels will push the price to $0.73, further bullish pressure increase will increase the price to $0.74 levels. Below the current price level are support levels of $0.70, $0.69 and $0.68.
AUDUSD medium-term Trend: Bullish
On the 4-hour chart, AUDUSD is bullish. The bulls are trying to dominate the AUDUSD market. The bullish movement commenced at $0.70 level. The resistance level of $0.71 is already broken upside. There was a pullback yesterday. The bulls’ momentum is currently increasing towards $0.7 level.
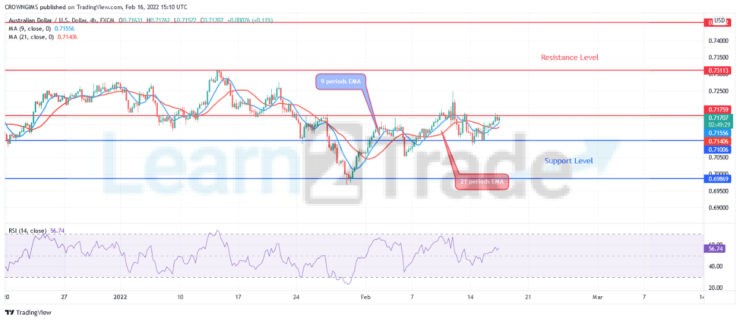
AUDUSD is trading slightly above the 9 periods EMA and 21 periods EMA. The relative strength index period 14 is at 56 levels and the signal lines pointing up to indicate a buy signal.
- Broker
- Min Deposit
- Score
- Visit Broker

- Award-winning Cryptocurrency trading platform
- $100 minimum deposit,
- FCA & Cysec regulated

- 20% welcome bonus of upto $10,000
- Minimum deposit $100
- Verify your account before the bonus is credited
- Fund Moneta Markets account with a minimum of $250
- Opt in using the form to claim your 50% deposit bonus
Learn to Trade
Never Miss A Trade Again

Signal Notification
Real-time signal notifications whenever a signal is opened, closes or Updated

Get Alerts
Immediate alerts to your email and mobile phone.

Entry Price Levels
Entry price level for every signal Just choose one of our Top Brokers in the list above to get all this free.