

Buyers’ momentum increases
AUDUSD Price Analysis – 14 June
In case buyers are successful in maintaining the $0.67 support level, the AUDUSD may rise over the $0.68, $0.70, and $0.72 resistance levels. If sellers gain additional traction, the price might fall much further, to levels of $0.66 and $0.65 or possibly lower if the $0.67 support level is breached
AUD/USD Market
Key levels:
Resistance levels: $0.68, $0.70, $0.72
Support levels: $0.67, $0.66, $0.65
AUDUSD Long-term Trend: Bullish
AUDUSD in the daily chart shows a bullish movement. Last week, buyers were in charge of the currency pair. When bears were in charge of the market, the support level of $0.64 was tested. At the previously specified level, a solid pin bar is formed, and the price moves upward. Daily bullish candles increased in number and the price increased. The price has breached the previous resistance levels of $0.65 and $0.67, exposing the resistance level of $0.68.
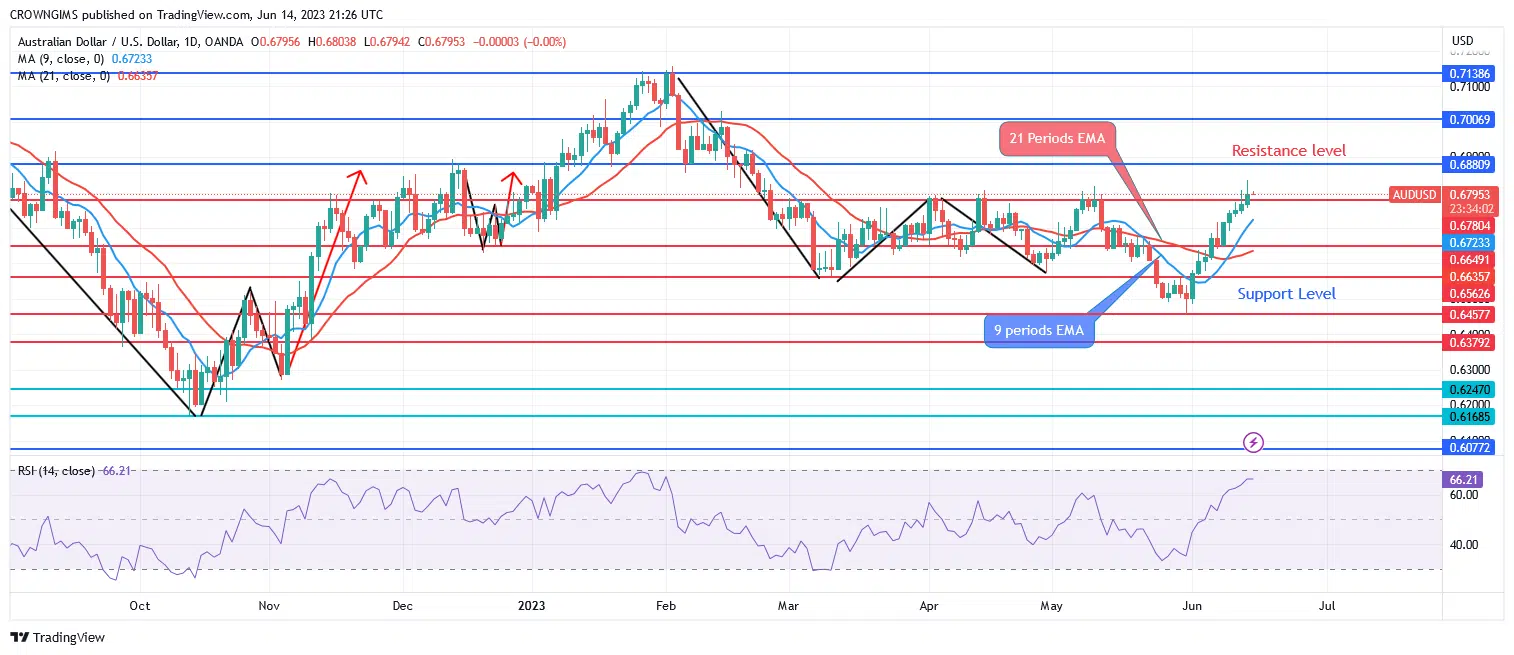
A bullish trend is present when the currency pair trades above the 9-period and 21-period exponential moving averages. In case buyers are successful in maintaining the $0.67 support level, the AUDUSD may rise over the $0.68, $0.70, and $0.72 resistance levels. If sellers gain additional traction, the price might fall much further, to levels of $0.66 and $0.65 or possibly lower if the $0.67 support level is breached.
AUDUSD medium-term Trend: Bullish
AUDUSD is bullish on the 4-hour chart. A few weeks ago, the price began to fall and move past the $0.67 support level. While being supported by sellers close to the target level, the price dropped below its prior low of $0.65 and tested the $0.64 level. The market was run by the vendors. Bulls support the previous level, and the price moves above $0.67 in an attempt to reach $0.68.

AUDUSD is trading above the 9-period and 21-period exponential moving averages as a sign of a bullish market. Relative Strength Index period 14 points down at 62 levels, indicating a sell signal.
You can purchase Lucky Block here. Buy LBLOCK


