

Bears’ momentum increases
AUDUSD Price Analysis – 19 July
If buyers are able to hold the $0.66 support level, the AUDUSD may move above the $0.67, $0.68, and $0.69 resistance levels. The price may drop much further if sellers gain momentum, possibly reaching levels of $0.65 and $0.64 or even lower if the $0.66 support level is breached.
AUD/USD Market
Key levels:
Resistance levels: $0.67, $0.68, $0.69
Support levels: $0.66, $0.65, $0.64
AUDUSD Long-term Trend: Bearish
On the daily chart, AUDUSD is moving downward. Investor fervor caused the price to soar to a high of $0.68 on June 15. The following day, an evening star candle pattern could be seen at the same level, signaling that the bulls’ power had run out. A strong daily bearish candle gave sellers control of the AUDUSD market. The $0.66 level was tested after the $0.67 support level was breached. Following a price adjustment the previous week, Sellers remain in charge of the market.
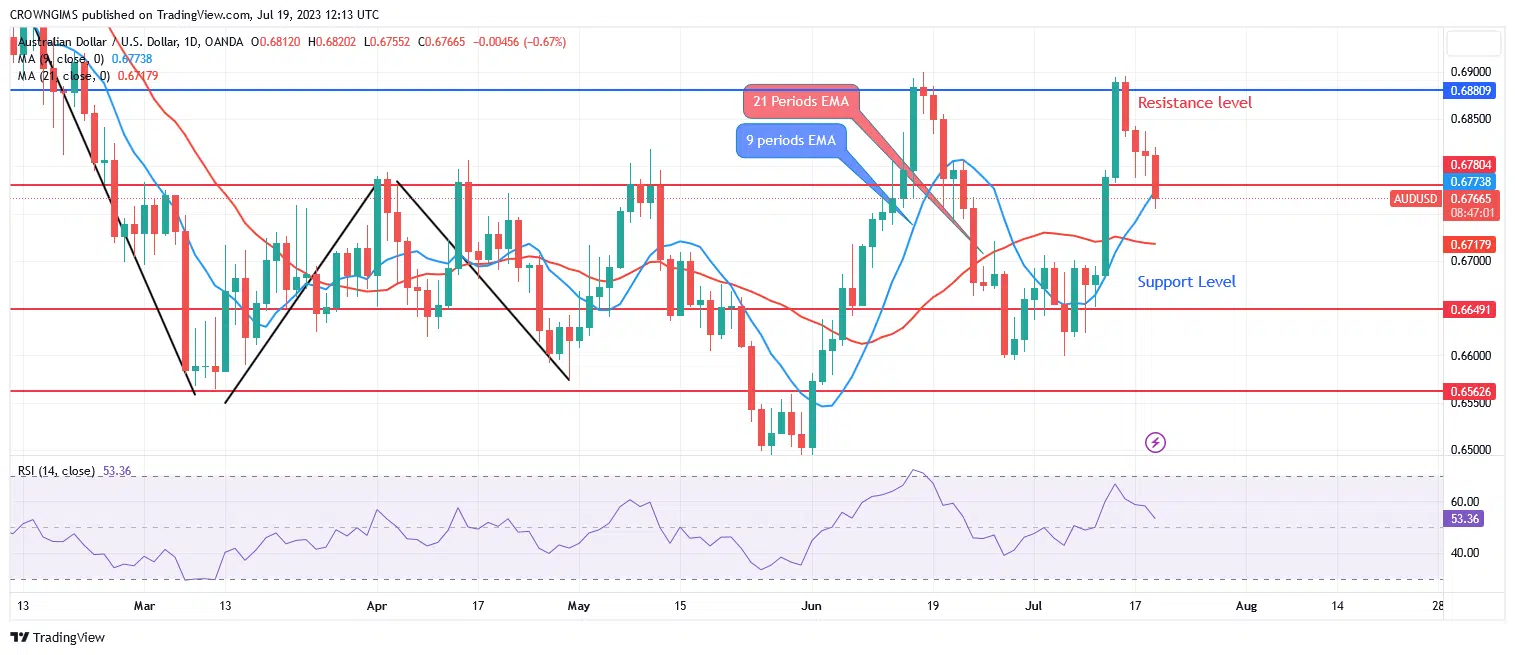
When the currency pair trades above the 9-period and 21-period exponential moving averages, a bullish trend is clearly visible. If buyers are able to hold the $0.66 support level, the AUDUSD may move above the $0.67, $0.68, and $0.69 resistance levels. The price may drop much further if sellers gain momentum, possibly reaching levels of $0.65 and $0.64 or even lower if the $0.66 support level is breached.
AUDUSD medium-term Trend: Bearish
AUDUSD is bearish on the 4-hour chart. The price started to decline and move past the $0.67 support level last week. The price fell below its previous low of $0.67 and probed the $0.66 level while being supported by sellers at the target level. At the aforementioned level, the bulls were fighting against the negative trend. Currently, price is pulling back.

As a sign of a bearish market, AUDUSD is currently trading below the 9-period and 21-period exponential moving averages. A buy signal is being given by the relative strength index period 14 going upward at 46 levels which may be a pullback.
You can purchase Lucky Block here. Buy LBLOCK


