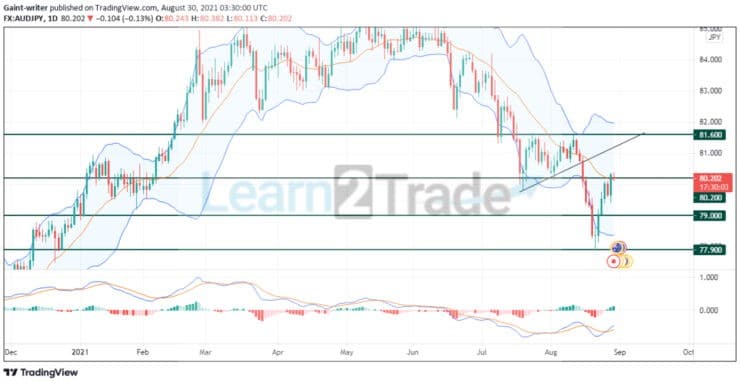
AUDJPY will bounce off some key levels in a bid to keep moving downwards. For some time now, price has been on a descent. Price has been sliding downwards and bypassing the key levels. After a retest activity at the 81.600 key level, AUDJPY continued moving downward. AUDJPY dived below the trend-line and a major demand level at 80.200 before slipping past another significant key region at 79.000. Bullish pressure, which is causing a change in the market, has risen considerably. AUDJPY is creating a new lower high before price continues its slump.
AUDJPY continues to fall due to violating the 80.200 demand level. Price should make a steady retracement before bearing on its bearish agenda. This retracement will be caused by upward pressure, and bulls will endeavor to rise somewhat before AUDJPY continues diving.
AUDJPY keeps climbing up, with the price aiming to break over 80.200 before retreating. Price initially offers a potential buy on the daily time frame when it changes direction at the 77.900 demand zone. However, this was caused by AUDJPY breaking out of the Bollinger Band. Price is now poised to overcome the middle band and rise to retest the upper band before price continues dipping.
AUDJPY Short Term Trends: Bearish
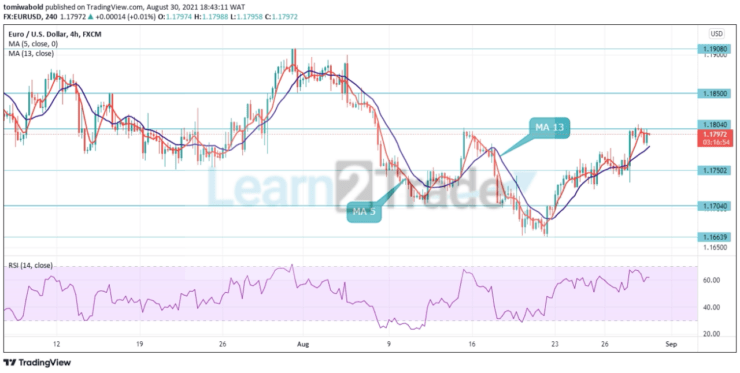
AUDJPY is predicted to climb beyond 80.200, retesting significant zones in the 4-hour time frame before bearing on its bearish movement. Before retracement, the market may break over the trend line and react at 81.600. The Bollinger Band indicator displays market responses at the upper band. This suggests a bearish reversal when the market pulls back to that zone. The MACD (Moving Average Convergence and Divergence) is displaying bullish histogram bars suggesting upward movement and crosses showing losses in bullish impetus. This, however, plainly indicates that sellers will soon dominate the market.
Note:Learn2.trade is not a financial advisor. Do your research before investing your funds in any financial asset or presented product or event. We are not responsible for your investing results.
Trade on MT4 with Leverage up to 1:500! Trade on MT4 with Leverage up to 1:500!
X
We use cookies to ensure that we give you the best experience on our website. If you continue to use this site we will assume that you are happy with it.