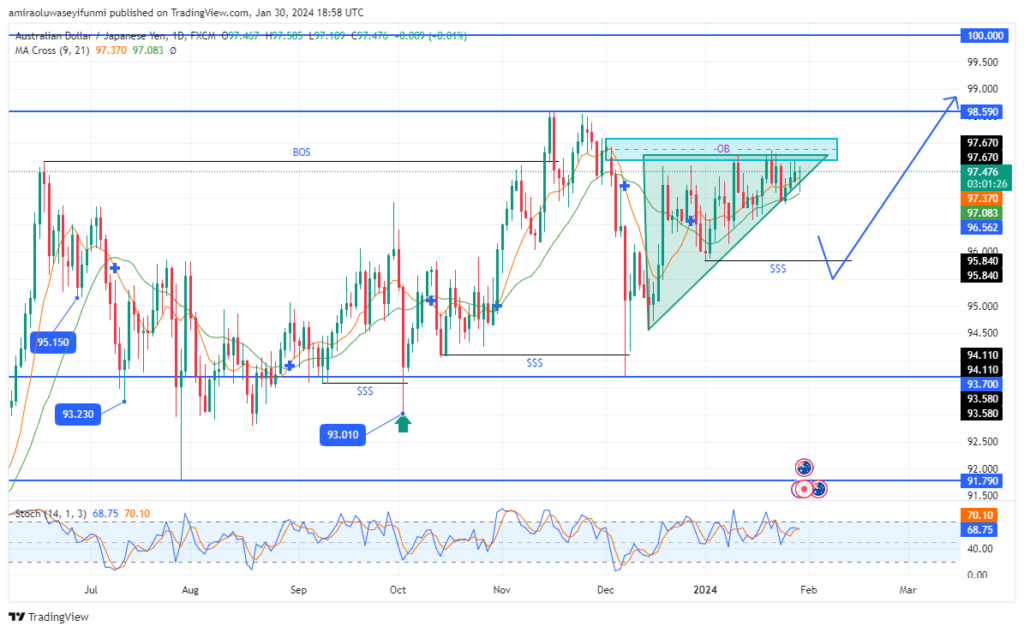
AUDJPY sustains a long-term bullish trend with an unaltered market structure. The market’s projection on the daily chart is bullish. The Stochastic Oscillator indicates a high possibility of the price declining anytime soon. However, a decline is likely to only last until the sell-side liquidity below 95.840 is swept. After which, a rally beyond the 98.590 resistance becomes imminent to generate forex signals.
At 97.670, AUDJPY experienced a crash fractally to the downside. The crash occurred in June 2023 after a massive surge had earlier occurred in the discount zone. The emerging downtrend made major lows at 95.150, 93.230, and 91.790 price levels. At 91.790, the bulls gained an upper hand in the market. AUDJPY expanded upward, clearing the previous highs that formed as the market fractally crashed in June and July 2023. Before the 97.670 high was invalidated, the market experienced a rapid dive into the 93.700 supply zone.
Price made a major low at 93.010 as it dived into the supply zone. The emerging uptrend eventually continued, finally invalidating the 97.670 high. Another crash ensued afterwards, with prices rapidly leaving the premium zone and entering the discount zone. The uptrend failed to resume until a sell-side liquidity grab below 94.110 in December 2023. The price is in an ascending triangle as it undergoes an accumulation phase below the bearish order block.
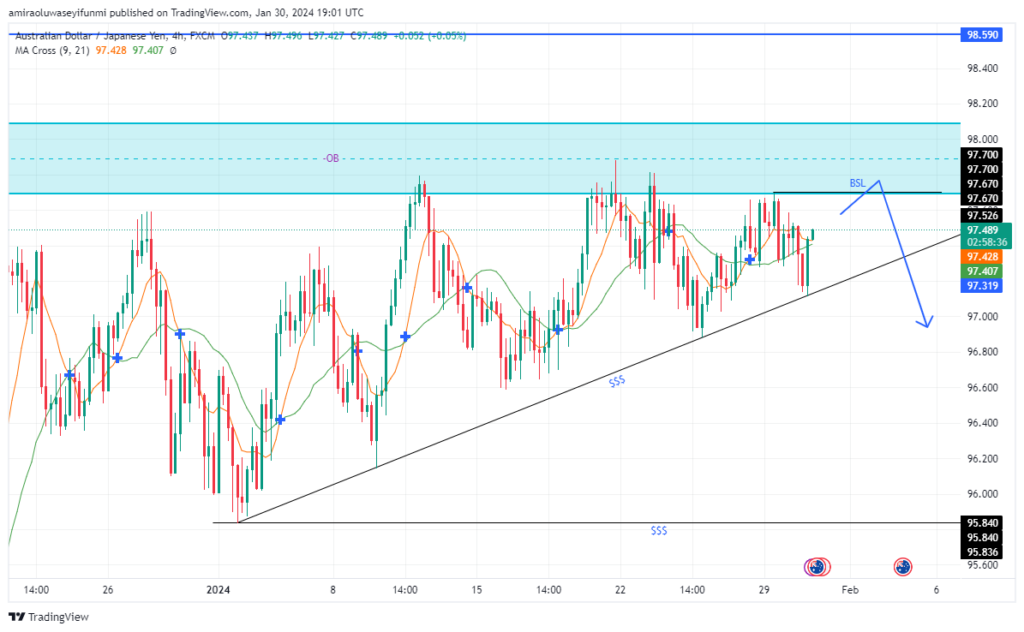
AUDJPY Short-Term Trend: Bearish
AUDJPY rallies alongside a diagonal support on the four-hour chart. The market seems to be experiencing increasing bearish pressure from the premium zone. A buy-side liquidity grab at 97.700 is expected to be followed by a massive decline, breaking through the diagonal support.
Trade on MT4 with Leverage up to 1:500! Trade on MT4 with Leverage up to 1:500!
X
We use cookies to ensure that we give you the best experience on our website. If you continue to use this site we will assume that you are happy with it.