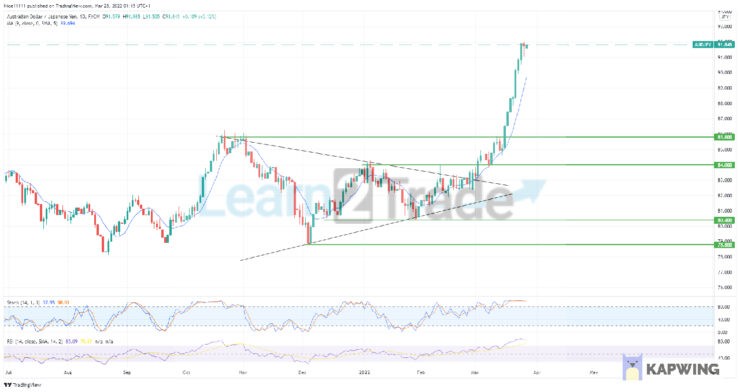
AUDJPY shows signs of weakness after the symmetrical triangle breakout on the daily timeframe. The market has formed lower highs and higher lows. This has caused the market to narrow down to the point of breakout. In the AUDJPY market, equal highs were created during October. The Moving Average changed sides to rest above the daily candlesticks on the 2nd of November, 2021. This eventually led to a change in the direction of the overall market.
The month of November was bearish on AUDJPY. A gravestone doji was formed on November 16, 2021. This was a valid sign of weakness. The market was seen to drop further. The market dipped into the demand zone at $78.80. The demand zone was used to go long in the market. The Australian Dollar was heavily sold to purchase the Japanese Yen.
The supply zone at $84.00 was reached on the 4th of January. The stochastic was oversold. A break in the market structure led the market to the $80.40 demand zone. On the 20th of June, a gravestone doji was formed to reveal the sign of weakness before the demand zone was reached. The bulls used the confluence of the demand zone at $80.40 and the upward trend line to launch an upward move.
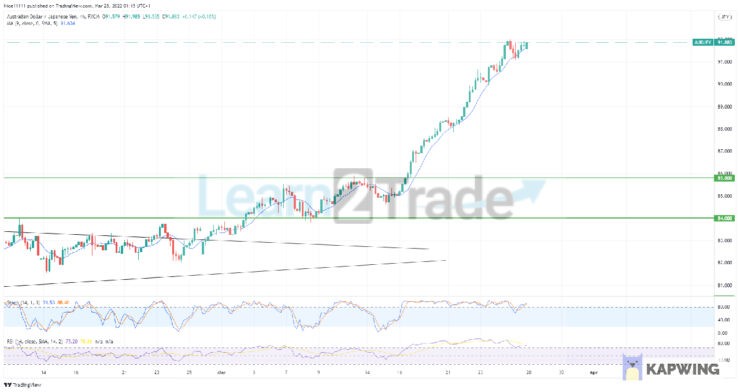
AUDJPY Short term trend: Bullish
The bullish move broke the symmetrical triangle structure. The market has been very bullish since then. There were eight consecutive bullish days. The night ended with a hanging-man candlestick pattern. This is a sign of weakness that the market might drop to the previous resistance zone at $85.80. The Stochastic is currently overbought. Similarly, the Relative Strength Indicator is also overbought. The market is likely to make a reversal pattern very soon, causing a sink in the market price.
Note:Learn2.trade is not a financial advisor. Do your research before investing your funds in any financial asset or presented product or event. We are not responsible for your investing results.
Trade on MT4 with Leverage up to 1:500! Trade on MT4 with Leverage up to 1:500!
X
We use cookies to ensure that we give you the best experience on our website. If you continue to use this site we will assume that you are happy with it.