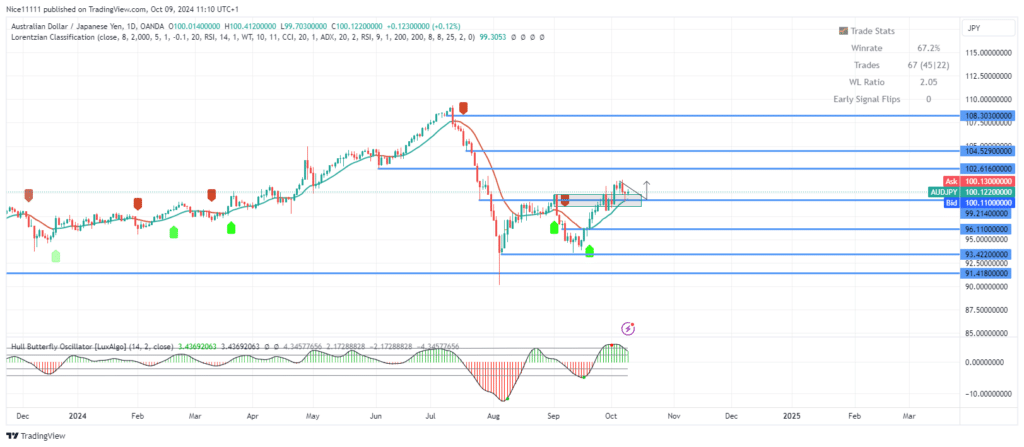
AUDJPY has surged above the key resistance zone at 110.10, signaling the potential beginning of a bullish trend. This breakthrough reflects growing buyer strength in the market After pushing past this resistance, the price retraced back into the zone, where it is now seeking support, setting the stage for a potential bullish continuation.
AUDJPY Key Levels
Demand Levels: 96.110, 93.420, 91.420
Supply Levels: 102.620, 104.530, 108.300
AUDJPY Long-term Trend: Bullish
AUDJPY’s climb from the demand level at 91.420 encountered initial resistance upon contact with the bearish order block at 100.110. This level temporarily halted the price ascent as the market absorbed selling pressure in the region.
After a brief deflection, bullish momentum built again, leading to a decisive move past the swing high at this key level. This second breakout attempt was reinforced by signals from the Machine Learning Lorentizan Classification indicator, which confirmed the bullish entry. The Hull Butterfly indicator further supports this trend by highlighting strong underlying momentum driving the pair upward.
AUDJPY Short-term Trend: Bullish
In the short term, AUDJPY’s pullback into the resistance-turned-support zone has led to the formation of a hammer candle, suggesting a possible continuation of the upward movement. On the four-hour chart, the price has tested a bullish order block around 99.210, showing early signs of a rebound. The recent pullback offers a strategic opportunity for identifying optimal trade entries and generating forex signals, as the market prepares for another potential upward move.
Trade on MT4 with Leverage up to 1:500! Trade on MT4 with Leverage up to 1:500!
X
We use cookies to ensure that we give you the best experience on our website. If you continue to use this site we will assume that you are happy with it.

 AUDJPY Short-term Trend: Bullish
 AUDJPY Short-term Trend: Bullish


