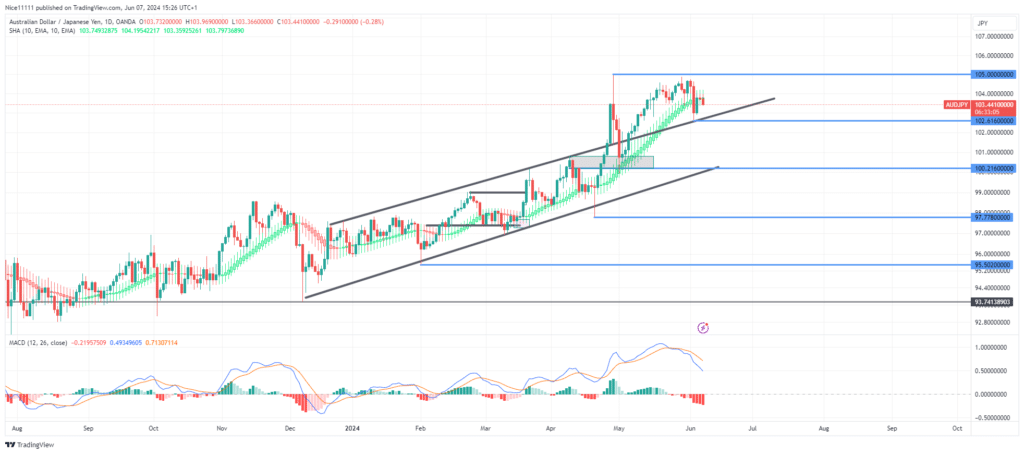
The AUDJPY bullish displacement from 102.20 has failed to reach the current year’s high of 105.00. The price has since pulled back to retest a bullish trendline on the daily chart, seeking to regain bullish momentum.
After expending significant energy to create the year-high of 105.00, AUDJPY dipped back to the bullish breaker at 100.20. During this dip, the price retested the Smoothed Heikin Ashi Candles at the same region of the breaker block, which provided support and propelled the price back towards the previous high.
Following this retest, the price rallied strongly but formed a double-top pattern near the peak of the previous swing high, signalling market weakness. Consequently, the price crashed, falling short of surpassing the previous high. The MACD line and the signal line have crossed, indicating a bearish trend.
AUDJPY Short-Term Trend: Bearish
On the 4-hour chart, the recent price dip has established a bearish shift in market structure. The pullback has tested the trendline, which is expected to provide support to maintain the higher-timeframe uptrend. However, if the trendline fails to sustain the longer-term bullish trend, it could lead to a change in market direction.
Note: Learn2.trade is not a financial advisor. Do your research before investing your funds in any financial asset or presented product or event. We are not responsible for your investing results.
Trade on MT4 with Leverage up to 1:500! Trade on MT4 with Leverage up to 1:500!
X
We use cookies to ensure that we give you the best experience on our website. If you continue to use this site we will assume that you are happy with it.

 AUDJPY Short-Term Trend: Bearish
 AUDJPY Short-Term Trend: Bearish


