Don’t invest unless you’re prepared to lose all the money you invest. This is a high-risk investment and you are unlikely to be protected if something goes wrong. Take 2 minutes to learn more
Market Analysis – November 16
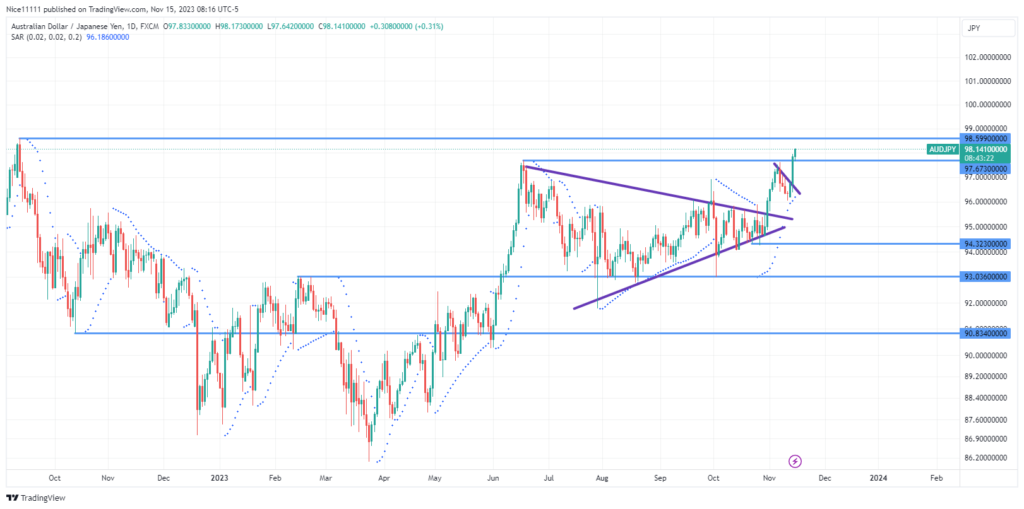
AUDJPY experiences a bullish breakout from a symmetrical triangle. The price has taken off to the moon after so much contention with the bears.
AUDJPY witnessed intense volatility at the inception of June. The market experienced an impulsive phase in favour of the buyers. The price took off from the demand zone of 90.830 to the resistance level of 97.670. The Parabolic SAR (Stop and Reverse) points rested below the daily candles to reveal the uptrend.
Immediately after the resistance level of 97.670 was tested the Momentum indicator revealed a steep fall showing the exhaustion of bulls. The market deteriorated immediately into a consolidation phase. The consolidation took on the shape of a symmetrical triangle. This was formed with consistent higher lows and lower highs. Just close to the narrow end of the opposing trendlines, the price regained its bullish momentum. Three white soldiers established the breakout with consecutive bullish candles following.
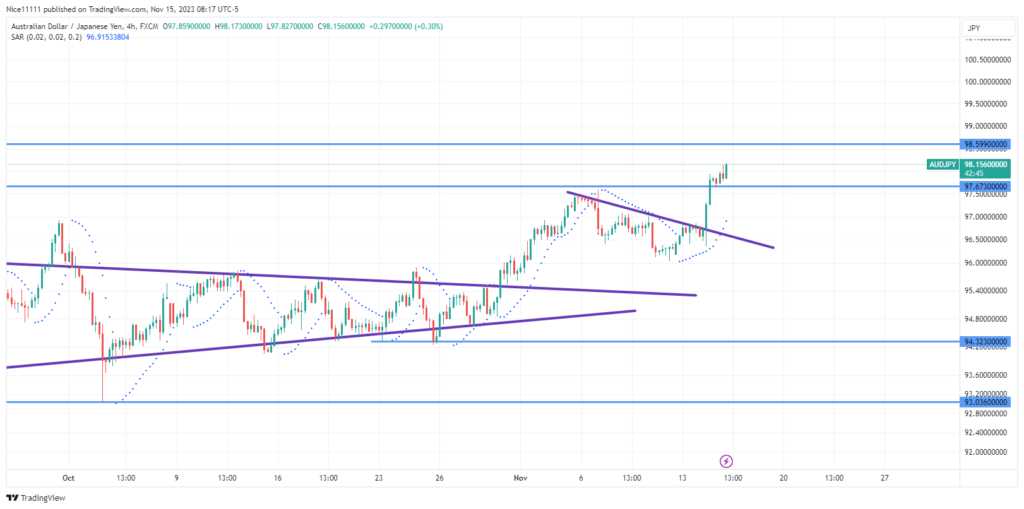
AUDJPY Short-Term Trend: Bullish
The price has drawn reached the resistance level of 97.670. The market structure on the 4-hour chart is clearly bullish. The Parabolic SAR (Stop and Reverse) indicator reveals the current price rise on the higher and lower time-frame (daily and 4 hours). It is expected that the price will strike the resistance level of 98.590 shortly.
Trade on MT4 with Leverage up to 1:500! Trade on MT4 with Leverage up to 1:500!
X
We use cookies to ensure that we give you the best experience on our website. If you continue to use this site we will assume that you are happy with it.