Key Resistance Levels: 74.00, 76.00, 78.00
Key Support Levels: 58.00, 60.00, 62.00
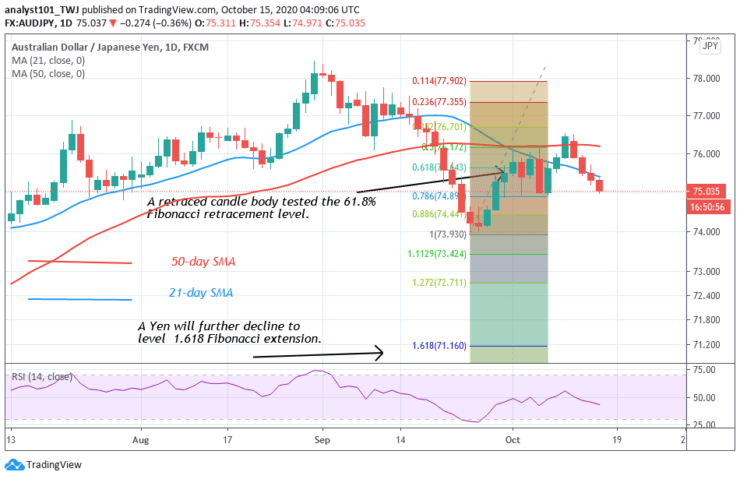
AUD/JPY Price Long-term Trend: Bearish
The AUD/JPY pair has been in a downward move. This is immediately after the rejection at level 76.50. A retraced candle body tested the 61.8% Fibonacci retracement level. This implies that the Yen will further decline to level 1.618 Fibonacci extension. That is level 71.16.
Daily Chart Indicators Reading:
The 21-day SMA and the 50-day SMA are sloping downward indicating the downtrend. The pair has fallen to level 43 of the Relative Strength Index period 14. This indicates that it is in the downtrend zone and below the centerline 50.
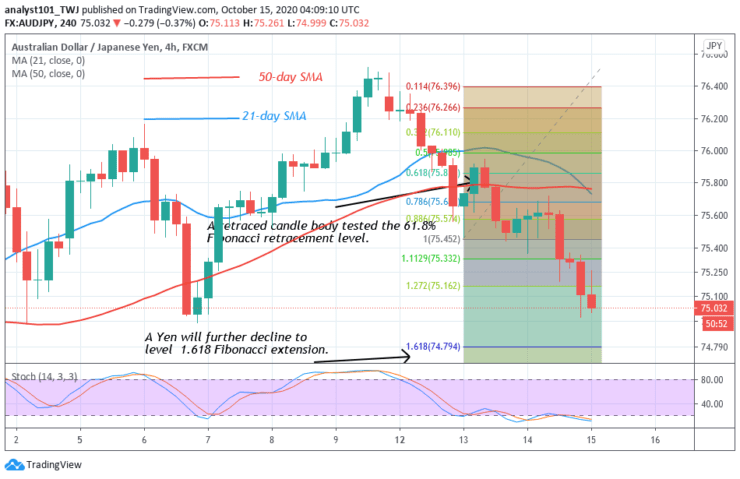
AUD/JPY Medium-term Trend: Bearish
On the 4-hour chart, the pair is in a downtrend. A retraced candle body tested the 61.8% Fibonacci retracement level. This implies that the Yen will further decline to level 1.618 Fibonacci extension. That is level 74.79.
4-hour Chart Indicators Reading
The AUD/JPY pair is currently below the 20% range of the daily stochastic. It indicates that the pair is in a bearish momentum. The market has fallen into the oversold region. The SMAs are sloping downward ward indicating the downtrend.
General Outlook for AUD/JPY
The AUD/JPY pair has been on a downward move since October 11. There is a likelihood of further downward move. According to the Fibonacci tool, the pair will reach level 71.16 on the daily chart. On the 4 –hour chart, the pair will fall to level 74.79.
Note: Learn2.Trade is not a financial advisor. Do your research before investing your funds in any financial asset or presented product or event. We are not responsible for your investing results
- Broker
- Min Deposit
- Score
- Visit Broker

- Award-winning Cryptocurrency trading platform
- $100 minimum deposit,
- FCA & Cysec regulated

- 20% welcome bonus of upto $10,000
- Minimum deposit $100
- Verify your account before the bonus is credited
- Fund Moneta Markets account with a minimum of $250
- Opt in using the form to claim your 50% deposit bonus
Learn to Trade
Never Miss A Trade Again

Signal Notification
Real-time signal notifications whenever a signal is opened, closes or Updated

Get Alerts
Immediate alerts to your email and mobile phone.

Entry Price Levels
Entry price level for every signal Just choose one of our Top Brokers in the list above to get all this free.