

Arbitrum Price Forecast: February 24
The Arbitrum price forecast suggests that further downward movement is likely, especially as the price has slipped below a key support level.
Arbitrum Long-Term Trend: Bearish (1-Day Chart)
Key Levels:
Resistance Levels: $0.4820, $0.5665
Support Levels: $0.3000, $0.3800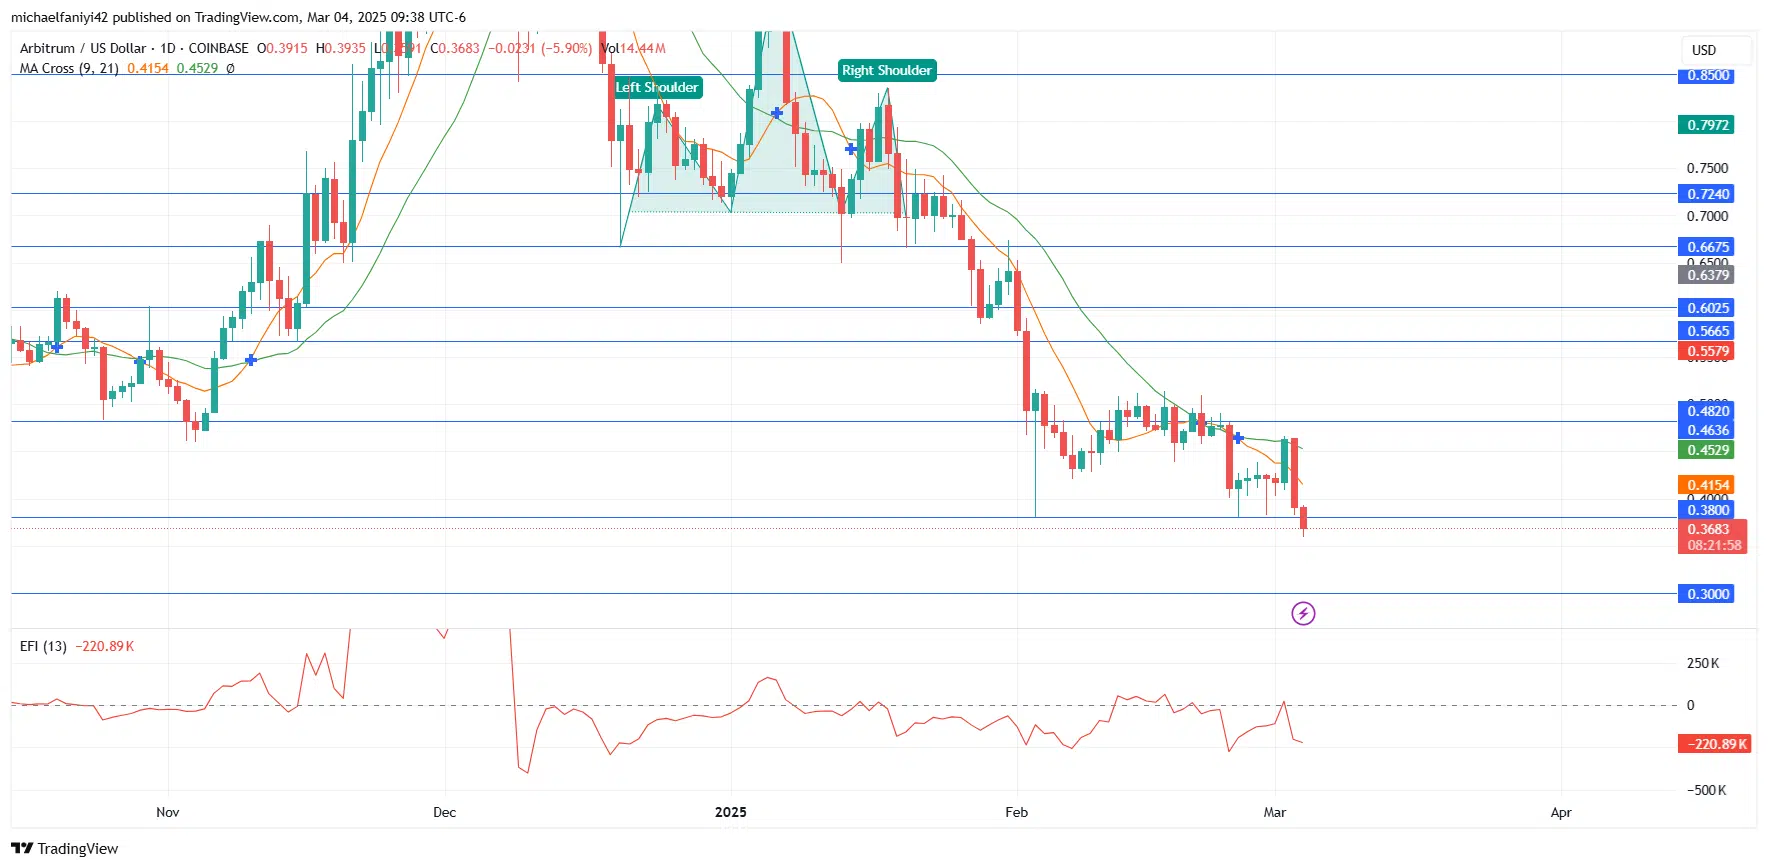
Arbitrum Price Forecast: ARB/USD Outlook
Arbitrum first tested the $0.3800 demand level on February 3rd after slipping below the $0.4820 supply zone.
The price briefly rebounded, leading to a struggle at $0.4820. However, as the MA Cross (Moving Average) confirmed a downward crossover, the price returned to $0.3800 and has now slipped below it.
The EFI (Elder’s Force Index) power line has made a sharp dip below the zero level, indicating that sellers have gained full control of the market.
ARB/USD Medium-Term Trend: Bullish (4-Hour Chart)
On the 4-hour timeframe, several downward crosses of the MA Cross had already signaled further decline before the price finally broke below $0.3800. With this breach, a continued drop toward $0.3000 now seems plausible.
Make money without lifting your fingers: Start using a world-class auto trading solution
How To Buy Lucky Block – Guide, Tips & Insights | Learn 2 Trade
Note: Learn2.trade is not a financial advisor. Do your research before investing your funds in any financial asset, product, or event. We are not responsible for your investment results.
- Broker
- Min Deposit
- Score
- Visit Broker

- Award-winning Cryptocurrency trading platform
- $100 minimum deposit,
- FCA & Cysec regulated

- 20% welcome bonus of upto $10,000
- Minimum deposit $100
- Verify your account before the bonus is credited


- Fund Moneta Markets account with a minimum of $250
- Opt in using the form to claim your 50% deposit bonus


