Don’t invest unless you’re prepared to lose all the money you invest. This is a high-risk investment and you are unlikely to be protected if something goes wrong. Take 2 minutes to learn more
Arbitrum Price Forecast: September 11
The Arbitrum price forecast is for a slight retracement, which will likely be followed by more price drops as the coin reaches a new all-time low.
Arbitrum Long-Term Trend: Bullish (1-Day Chart)
Key Levels:
Zones of supply: $0.9280, $1.1100
Zones of Demand: $0.8000, $0.7200
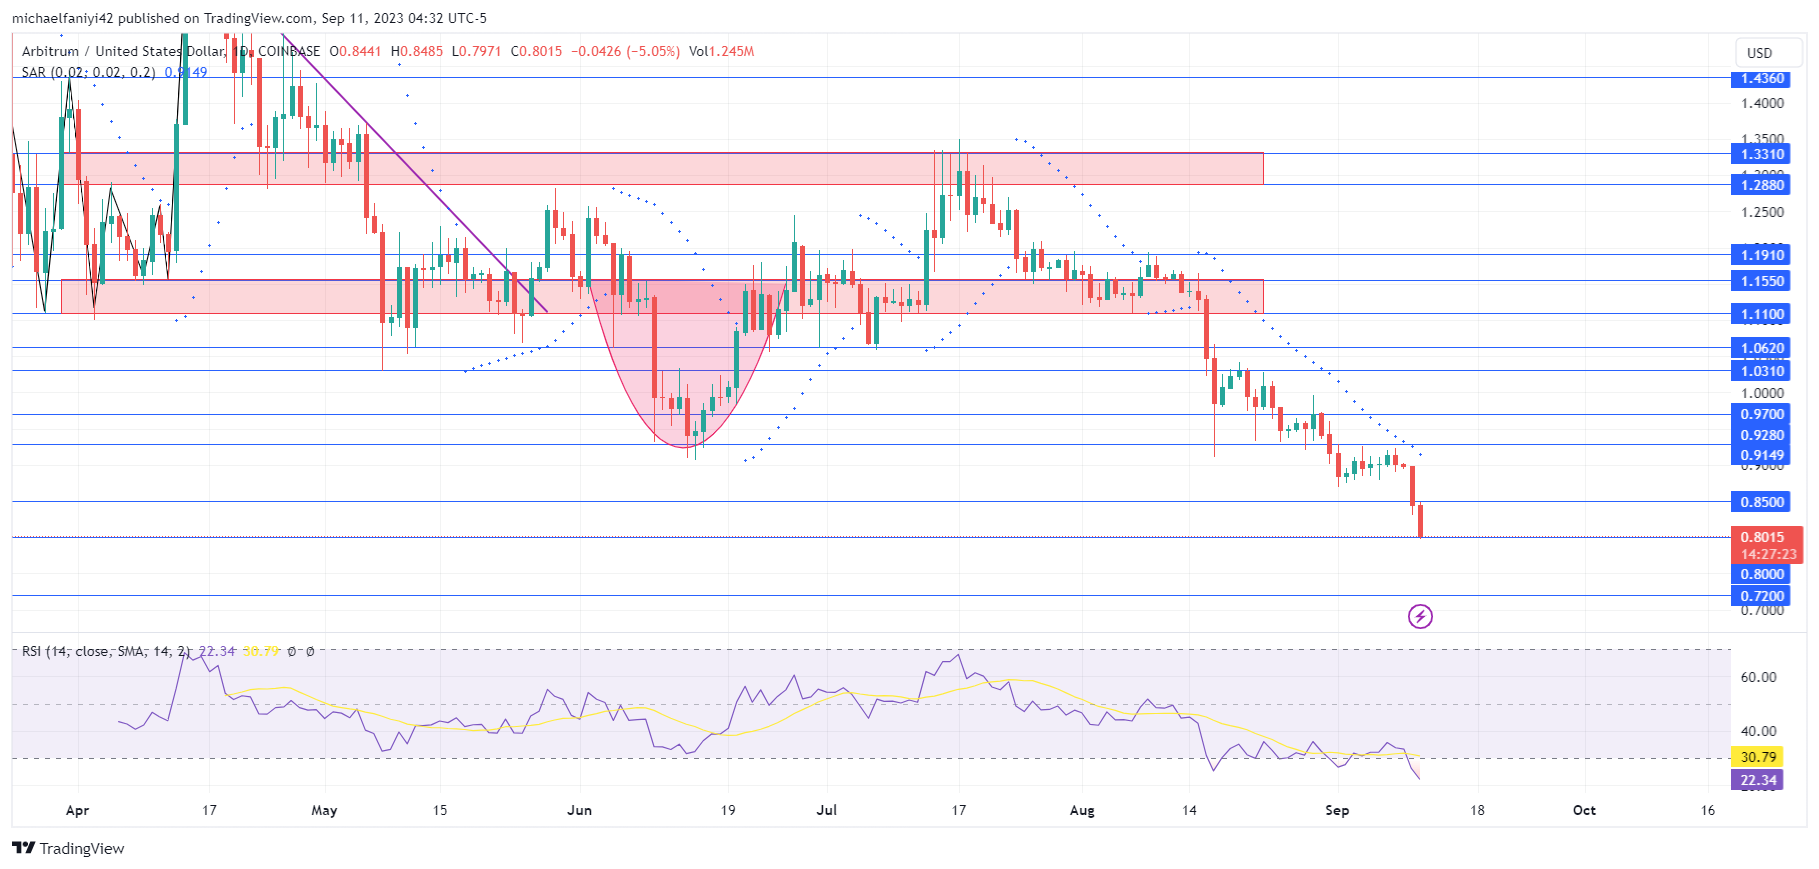
The Arbitrum market has created a new record for its lowest-ever point as it plunges below the $0.8500 demand level. Earlier in July this year, the coin was found trying to breach the $1.3310 resistance, but rejection at that point plunged the price back to the $1.1100 strong demand level. The coin found it hard to rally back up, leading to a slip, which in turn led the market to something of a free fall until it plunged below $0.8500. At this juncture, the bearish strength is still prevalent, and there could be even more drops.
Arbitrum Price Forecast: ARB/USD Outlook
The Arbitrum market has set a grim milestone as it recently breached the previously established demand level of $0.8500, marking a historic low.
In contrast, just this July, the coin attempted to violate the $1.3310 resistance level but was met with rejection, causing a sharp decline back to the robust support level at $1.1100.
Subsequent attempts to stage a recovery proved challenging, ultimately resulting in a prolonged downward spiral that culminated in a breach of the $0.8500 mark. At this juncture, bearish sentiment prevails, and further declines remain a distinct possibility.
ARB/USD Medium-Term Trend: Bullish (4-hour chart)
Since its descent from the $1.1100 zone, the Parabolic SAR (Stop and Reverse) indicator has consistently positioned itself above the candlesticks, indicating sustained weakness in buyer activity. Concurrently, the RSI (Relative Strength Index) has plummeted to oversold territory, hovering around the 25 mark.
Notably, on the 4-hour chart, the coin is seen to undergo a period of sideways movement below the $0.9280 level before its descent beneath $0.8500, prompting the Parabolic SAR to revert to its bearish alignment above the candles. With the breach of the $0.8500 support, the RSI has delved even deeper into oversold territory. There may be a possibility of a slight retracement shortly, potentially followed by a further drop towards the $0.8000 level.
Note: Learn2.trade is not a financial advisor. Do your research before investing your funds in any financial asset or presented product or event. We are not responsible for your investing results.
- Broker
- Min Deposit
- Score
- Visit Broker
- Award-winning Cryptocurrency trading platform
- $100 minimum deposit,
- FCA & Cysec regulated
- 20% welcome bonus of upto $10,000
- Minimum deposit $100
- Verify your account before the bonus is credited
- Fund Moneta Markets account with a minimum of $250
- Opt in using the form to claim your 50% deposit bonus
Learn to Trade
Never Miss A Trade Again

Signal Notification
Real-time signal notifications whenever a signal is opened, closes or Updated

Get Alerts
Immediate alerts to your email and mobile phone.

Entry Price Levels
Entry price level for every signal Just choose one of our Top Brokers in the list above to get all this free.


