Arbitrum Price Forecast: May 31
The Arbitrum price forecast is for the market to keep mounting pressure on the $1.2880 resistance level to weaken it.
Arbitrum Long-Term Trend: Bullish (4-hour Chart)
Key Levels:
Zones of supply: $1.2880, $1.3310, $1.4360
Zones of Demand: $1.1910, $1.1550, $1.0620
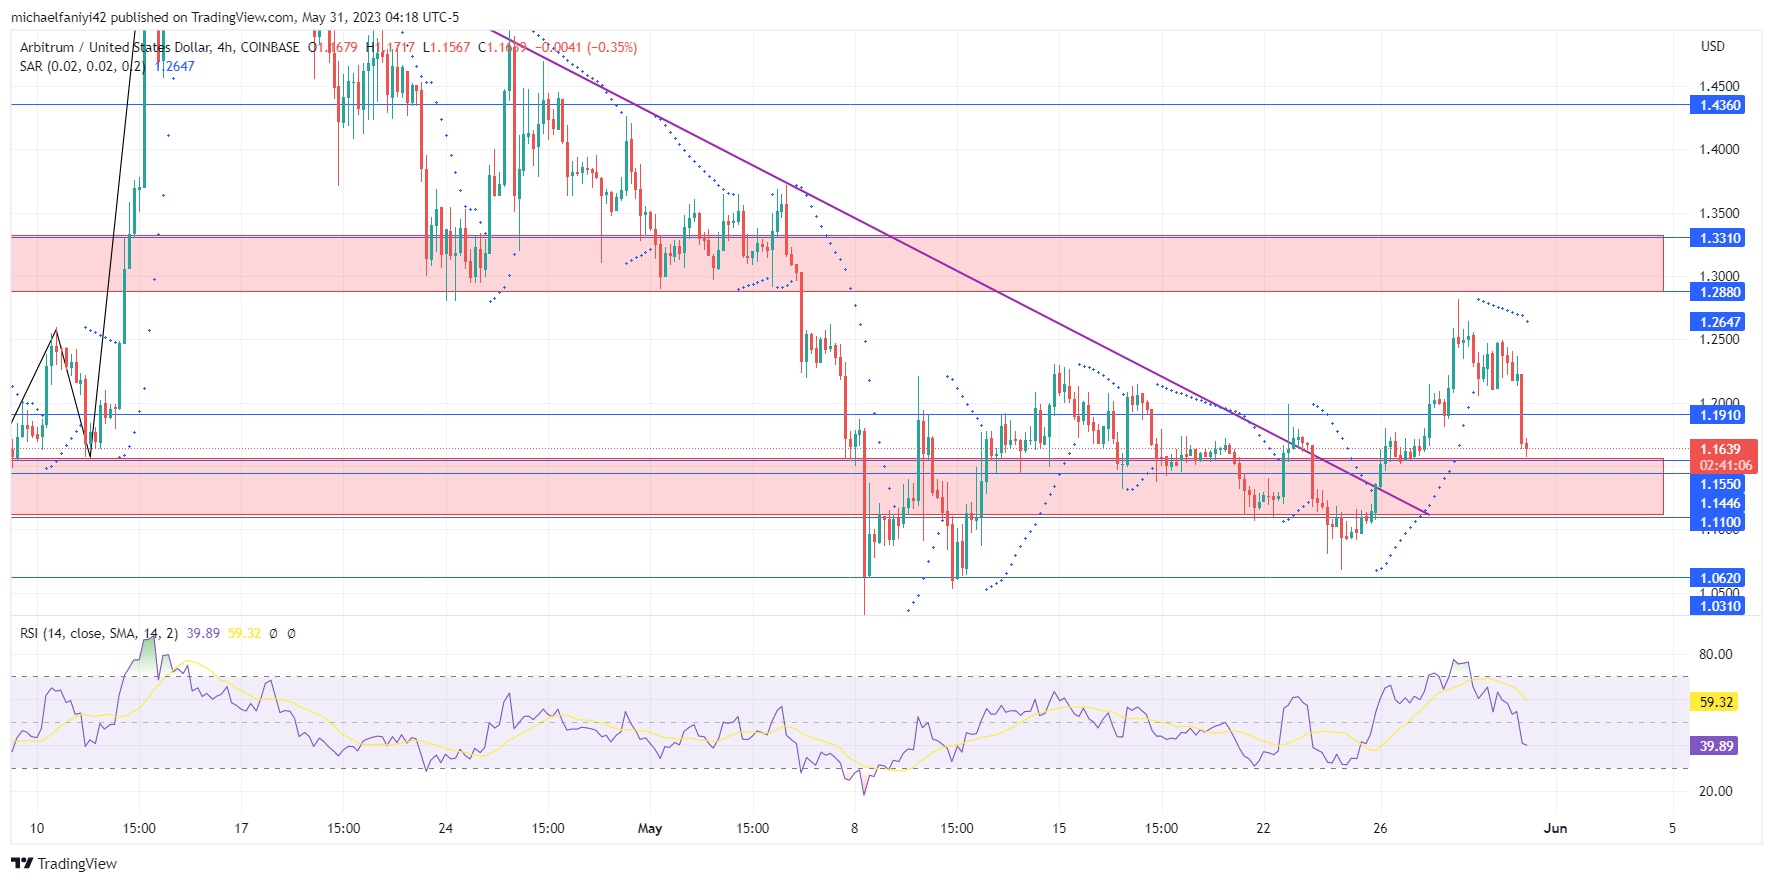
The Arbitrum market is ready to mount pressure on the resistance level at $1.2880 after breaking out from below a descending trendline. The price has declined since the market hit the highest resistance at $1.8170; however, the buyers have been revived and are now on the front foot. There has been an initial test at the $1.2880 supply line, and more will come as the price looks to break out again.
Arbitrum Price Forecast: ARB/USD Outlook
A bullish regime in the market was tempered when the price hit the $1.8170 resistance level in mid-April. Afterward, the coin is seen sliding down through the key levels.
This plunge continued until the price dropped to a lower level around $1.0310. At this point, more investors were able to buy into the market at a lower price. This helped increase the bullish impetus.
Arbitrum has now violated the descending trendline that ushered it downward and rose to test the $1.2880 resistance. The Parabolic SAR (Stop and Reverse) dots have switched above the candles as the price drops to the $1.1550 support.
ARB/USD Medium-Term Trend: Bullish (1-hour chart)
The RSI (Relative Strength Index) indicator rose into oversold territory as the price broke out and rose to test the $1.2880 resistance level. However, the resistance won’t bulge immediately, leading to a drop back to the $1.1550 support level. This is in the 4-hour timeframe.

On the 1-hour time frame, the RSI has dropped further to the oversold border while the Parabolic SAR dots remain aligned above the candlesticks. The $1.1550 support level is expected to keep the price afloat. From here, the coin is expected to make multiple tests against the resistance level for a breakout towards $1.1910.
How To Buy Lucky Block – Guide, Tips & Insights | Learn 2 Trade
Note: Learn2.trade is not a financial advisor. Do your research before investing your funds in any financial asset or presented product or event. We are not responsible for your investing results.
- Broker
- Min Deposit
- Score
- Visit Broker

- Award-winning Cryptocurrency trading platform
- $100 minimum deposit,
- FCA & Cysec regulated

- 20% welcome bonus of upto $10,000
- Minimum deposit $100
- Verify your account before the bonus is credited
- Fund Moneta Markets account with a minimum of $250
- Opt in using the form to claim your 50% deposit bonus
Learn to Trade
Never Miss A Trade Again

Signal Notification
Real-time signal notifications whenever a signal is opened, closes or Updated

Get Alerts
Immediate alerts to your email and mobile phone.

Entry Price Levels
Entry price level for every signal Just choose one of our Top Brokers in the list above to get all this free.