Don’t invest unless you’re prepared to lose all the money you invest. This is a high-risk investment and you are unlikely to be protected if something goes wrong. Take 2 minutes to learn more
While the API3 token stands as the second most profitable coin as of the time of writing, with a price increase of 10.39%, more interesting developments are likely to still occur in the market. Although the token’s price action has poked through a key technical level, there are indications suggesting that downward forces are still active in the market.
API3 Statistics
Current Price: $0.6809
Market Capitalization: $58.43M
Circulating Supply: 86.42M
Total Supply: 154.03M
CoinMarketCap Rank: 448
Key Price Levels
Resistance: $0.7000, $0.7500, $0.8000
Support: $0.6500, $0.6000, $0.5500
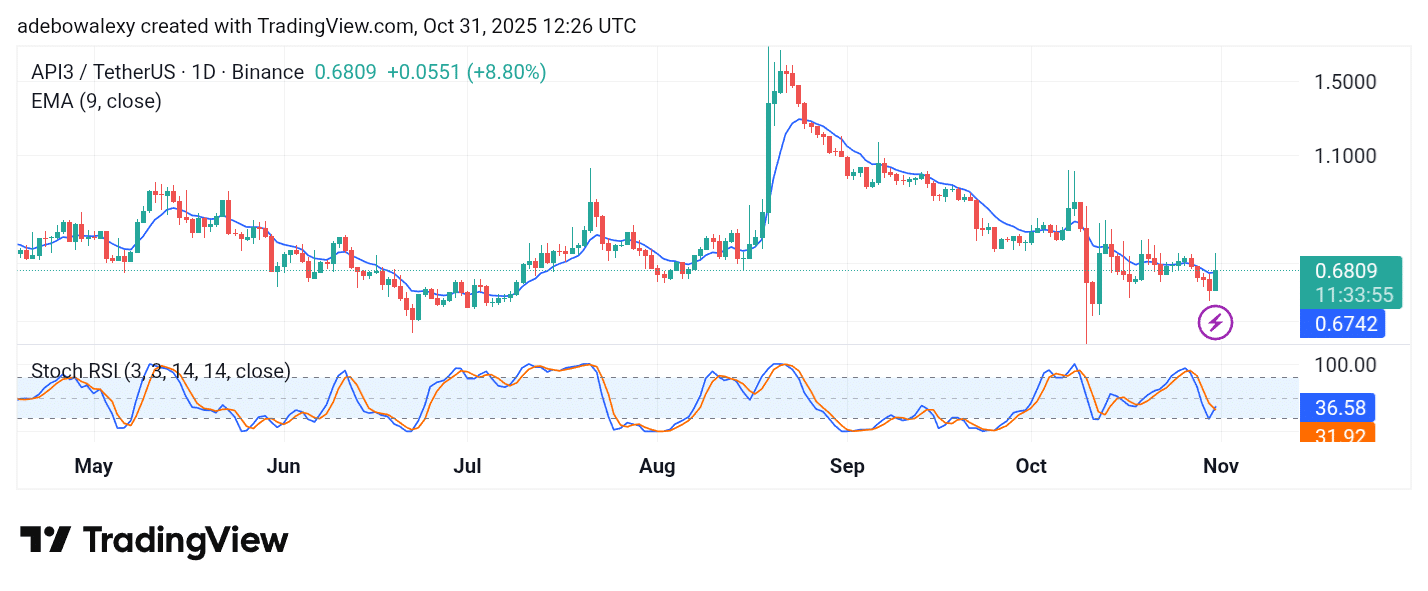
API3USDT Retreats Below the $0.7000 Mark
The ongoing session in the API3 market stands out as it posts a sharp upward rebound. It has pushed the token past the 9-day Exponential Moving Average (EMA) curve. However, there has been some contraction as the bears seem to have besieged the market around the $0.7000 price level.
This has initiated a pushback during the session. Meanwhile, the Stochastic Relative Strength Index (SRSI) indicator lines are at a crossover, which aligns with the fact that the token’s current price stands above the 9-day EMA curve. As such, this market still has the potential to push further upward in the coming sessions.
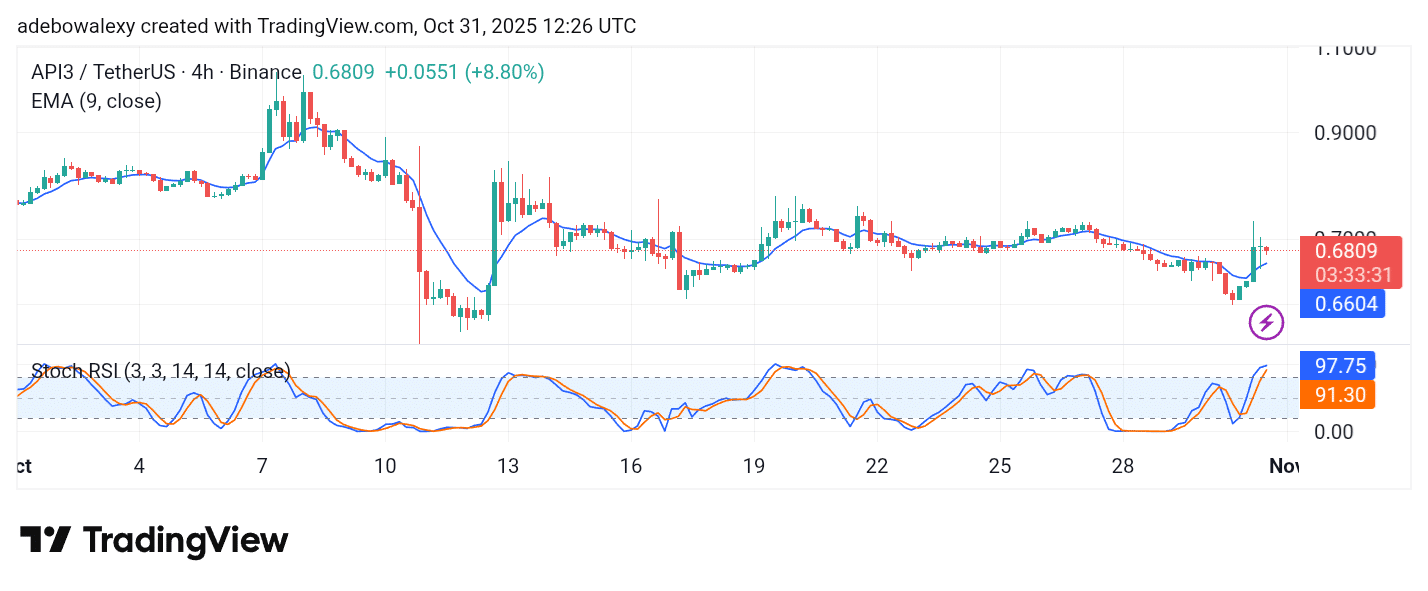
API3 Contraction Results in a Clear Retracement
The API3USDT market on the 4-hour chart reveals that price action had earlier contracted but has now yielded to a downward retracement. The ongoing session is represented by a small red price candle, though it remains above the 9-day EMA curve.
Similarly, the SRSI lines have risen past the 80 threshold, which seems a bit too fast given the modest price increase. The terminals of the SRSI indicator have also started converging. Nevertheless, it seems this market may resume an upside correction toward the $0.7250 mark, given that price action still remains above the 9-day EMA.
Make money without lifting your fingers: Start trading smarter today
- Broker
- Min Deposit
- Score
- Visit Broker

- Award-winning Cryptocurrency trading platform
- $100 minimum deposit,
- FCA & Cysec regulated

- 20% welcome bonus of upto $10,000
- Minimum deposit $100
- Verify your account before the bonus is credited
- Fund Moneta Markets account with a minimum of $250
- Opt in using the form to claim your 50% deposit bonus
Learn to Trade
Never Miss A Trade Again

Signal Notification
Real-time signal notifications whenever a signal is opened, closes or Updated

Get Alerts
Immediate alerts to your email and mobile phone.

Entry Price Levels
Entry price level for every signal Just choose one of our Top Brokers in the list above to get all this free.