The ApeCoin market has seen another considerable price increase today. Prices have increased by an impressive margin of 10.32%. Yet, there are technical signs suggesting a possible further price increase. Therefore, let’s take a closer look below.
ApeCoin Statistics
Current Price: $0.733
Market Capitalization: $547.07M
Circulating Supply: [Missing]
Total Supply: 1B
CoinMarketCap Rank: 108
Key Price Levels
Resistance: $0.8000, $0.9000, $1.0000
Support: $0.7000, $0.6000, $0.5000
 .8000 Resistance" width="1436" height="606" data-lazy-src="https://learn2.trade/wp-content/uploads/2025/06/APEUSDT_2025-06-06_11-35-40.png"/>
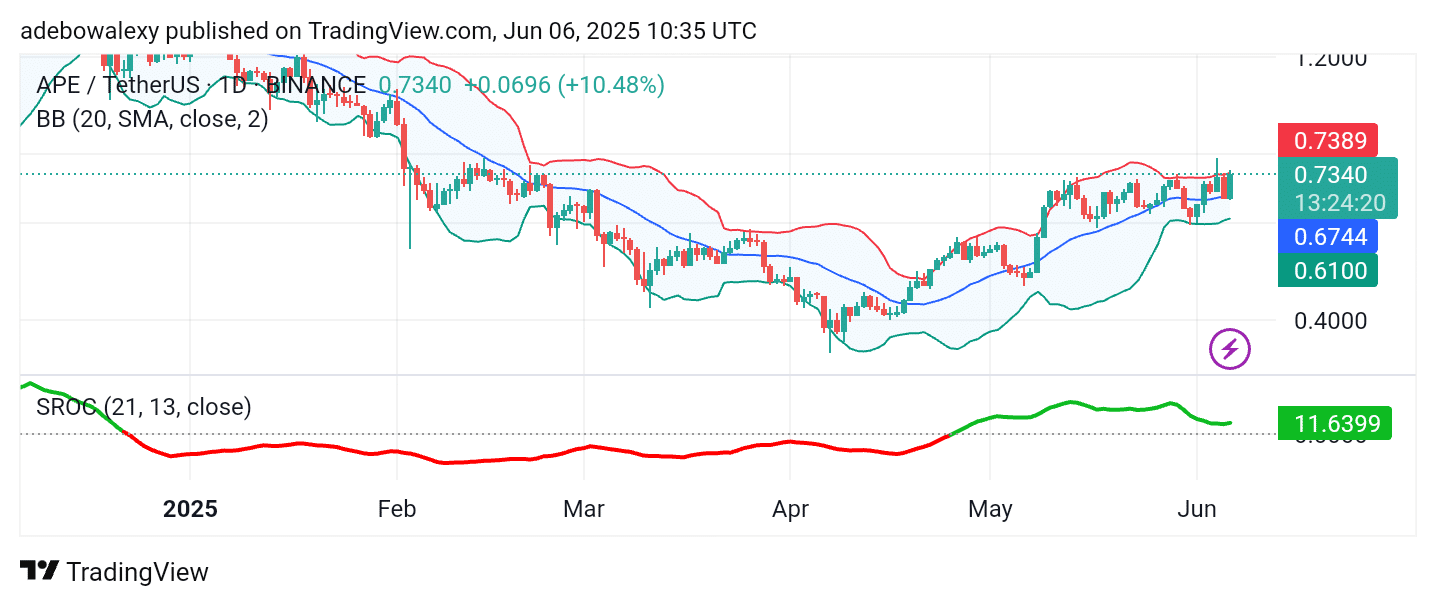
ApeCoin Sees a Notable Movement
Price activity in the APE/USDT daily market saw a sudden and notable dip in the previous session. This sharp downward retracement tested the support created by the middle Bollinger Bands. However, the baseline offered strong support to price action, which subsequently resulted in a strong rebound in the ongoing session. Consequently, the current session remains bullish, as indicated by the corresponding price candle.
Also, trading continues above the middle Bollinger Bands. The Bollinger Bands themselves appear tilted upwards, and their latter part seems slightly contracted. Meanwhile, the Smoothed Rate of Change (SROC) indicator line remains above the equilibrium level, with its terminal part now tending upward. This indicates that upside forces are still active and may lead to further price increases.
.8000 Resistance" width="1436" height="606" data-lazy-src="https://learn2.trade/wp-content/uploads/2025/06/APEUSDT_2025-06-06_11-36-10.png"/>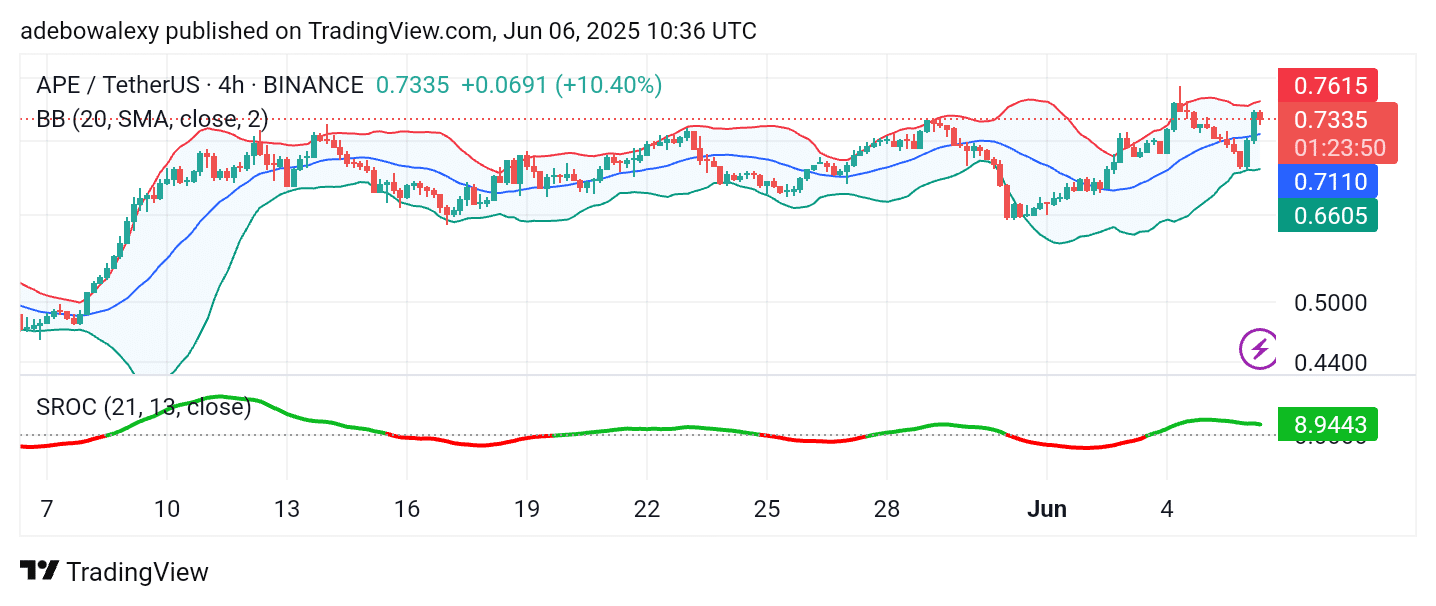
APE Sees a Minimal Setback
The ApeCoin market on the 4-hour chart experienced a minor rejection in the previous session. However, price action remains above the middle Bollinger Bands. The most recent price candle is red, but the token continues to trade above the midpoint of the Bollinger Bands.
Similarly, the Bollinger Indicator remains on an upward trajectory. Meanwhile, the SROC indicator line stays above the equilibrium level. Although the trajectory of this indicator appears somewhat sideways, the fact that it remains above the equilibrium line offers cautious optimism for bullish participants, speculating that price action may reach the $0.8000 level.
Make money without lifting your fingers: Start trading smarter today
- Broker
- Min Deposit
- Score
- Visit Broker

- Award-winning Cryptocurrency trading platform
- $100 minimum deposit,
- FCA & Cysec regulated

- 20% welcome bonus of upto $10,000
- Minimum deposit $100
- Verify your account before the bonus is credited
- Fund Moneta Markets account with a minimum of $250
- Opt in using the form to claim your 50% deposit bonus
Learn to Trade
Never Miss A Trade Again

Signal Notification
Real-time signal notifications whenever a signal is opened, closes or Updated

Get Alerts
Immediate alerts to your email and mobile phone.

Entry Price Levels
Entry price level for every signal Just choose one of our Top Brokers in the list above to get all this free.