Don’t invest unless you’re prepared to lose all the money you invest. This is a high-risk investment and you are unlikely to be protected if something goes wrong. Take 2 minutes to learn more
The AMP token has been facing reduced volatility for an extended period of six months. As a result, more recent sessions have brought some upside gains, but only as the constraints in the market allow. Today’s trading has recorded a price increase of 2.82% at the time of writing. Let’s see what can be expected in this market.
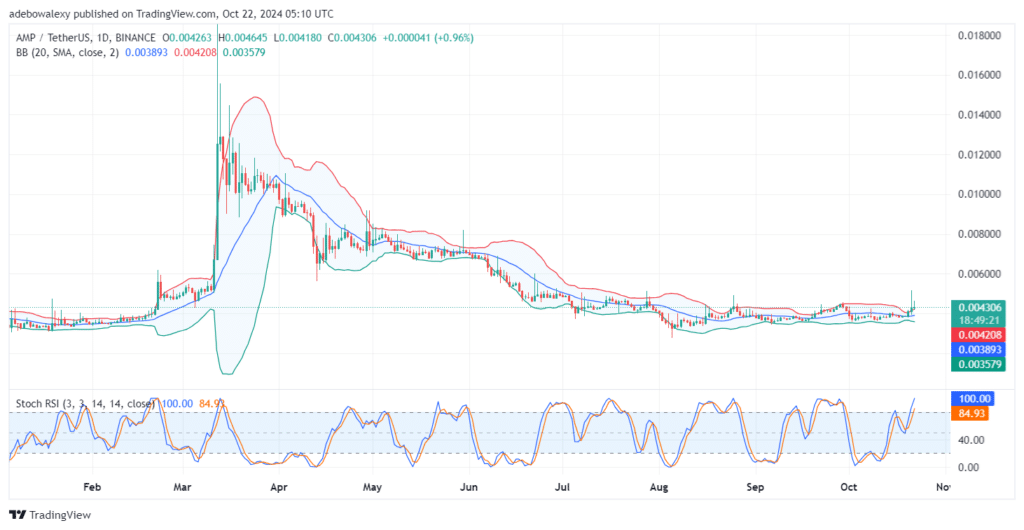
Price movement in the AMP/USDT daily market has seen a bullish breakout, which started about two sessions ago. This occurred when price action leaped off the middle limit of the Bollinger Bands indicator. However, due to the reduced volatility in the market, price action quickly hit the upper limits of the Bollinger Bands, resulting in a downward rejection during the session.
While today’s session has seen considerable rejection, the corresponding price candle can still be seen hugging the uppermost limit of the Bollinger Bands. Additionally, the Stochastic Relative Strength Index (RSI) lines can now be seen rising into the overbought region, although the leading line has already hit the indicator’s 100 mark.
The AMP/USDT Market Maintains a Conflicted Look
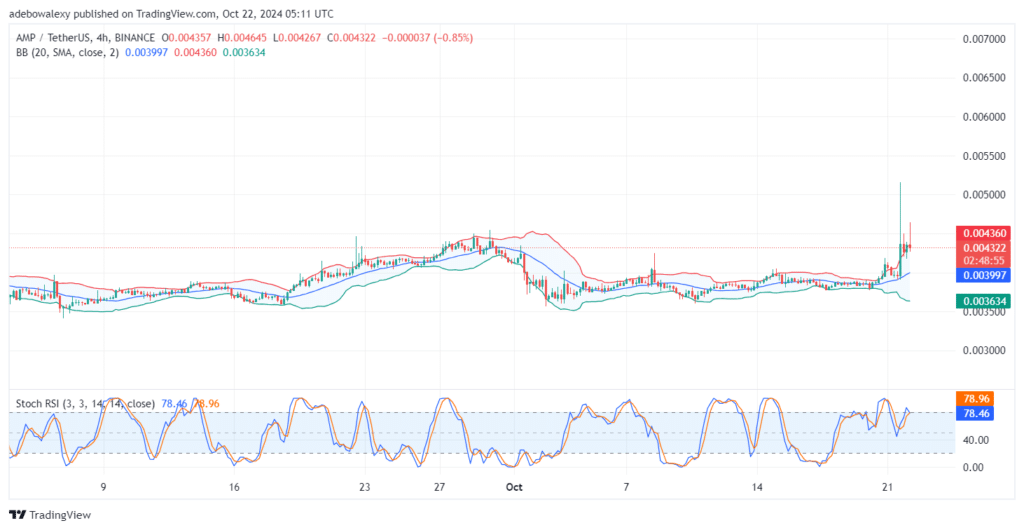
Extending the scope of the AMP market to a 4-hour chart shows that the downward contraction of price movements has progressed into a downward retracement. The last price candle shows contraction before turning bearish, signaling that prices may decline.
Meanwhile, the Stochastic RSI indicator curves are now converging for a bearish crossover at the 80 mark, signaling that downward forces may gain prominence, driving the market lower from this point. Therefore, traders can begin utilizing crypto signals targeting the $0.004000 price level. However, traders should also track Bitcoin’s price and other relevant fundamentals for guidance.
Trade on MT4 with Leverage up to 1:500! Trade on MT4 with Leverage up to 1:500!
X
We use cookies to ensure that we give you the best experience on our website. If you continue to use this site we will assume that you are happy with it.