Don’t invest unless you’re prepared to lose all the money you invest. This is a high-risk investment and you are unlikely to be protected if something goes wrong. Take 2 minutes to learn more
The AMP/USD price action has retracted upwards in the current session, as it moved by 1.54%. Nevertheless, even after such a movement, price activities in this market don’t seem to have performed that impressively.
AMP Analysis Data
AMP Value Now: $0.002620
AMP Market Cap: $109,346,914
AMP Moving Supply: 42,227,702,186
AMP Total Supply: 99,213,408,535
AMP CoinMarketCap Ranking: 192
Major Price Levels:
Top: $0.002650, $0.002700, and $0.002750
Base: $0.002620, $0.002600, and $0.002570
 .002408, After Moving by 1.54%" width="1255" height="668" data-lazy-src="https://learn2.trade/wp-content/uploads/2023/05/AMPUSD_2023-05-24_20-47-48.png"/>
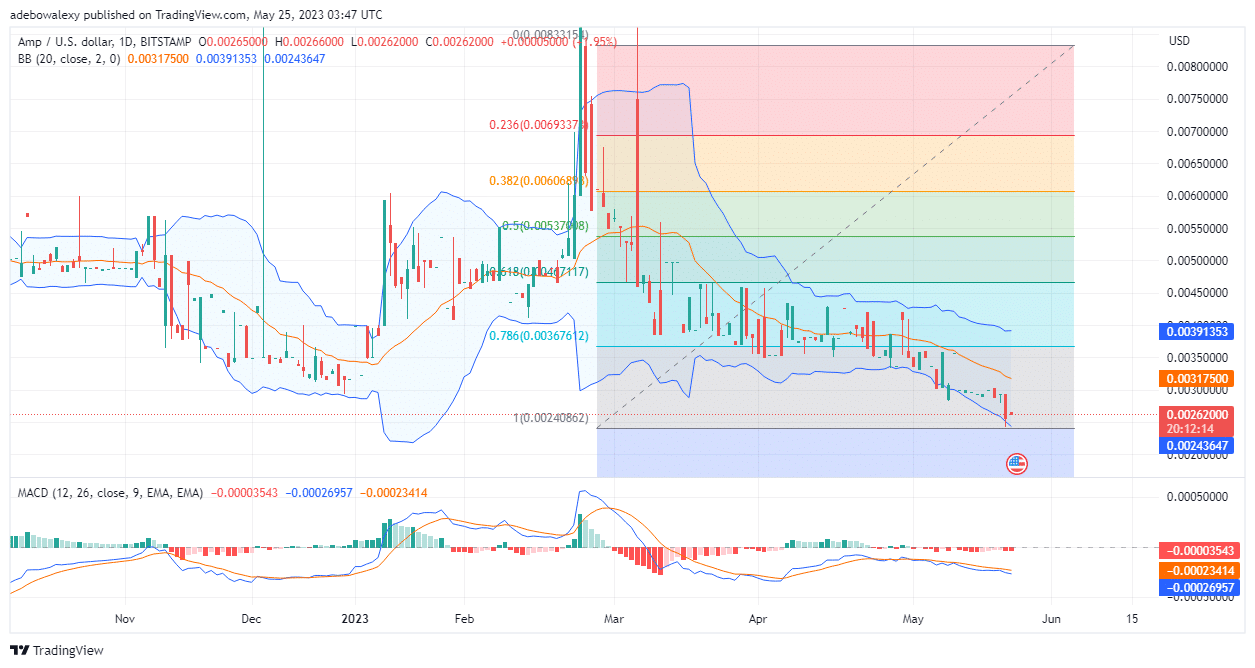
AMP/USD Price Action Stays Bearish
Trading activities in the AMP/USD market haven’t displayed much of impressive characteristics. This is because the market still seems to be heading downward. The last price candle in this market seems to have only retracted upwards from the price level of $0.002408 in the ongoing session. Consequently, the price of this coin has arrived at the 0.002620 price mark. Meanwhile, the Moving Average Convergence Divergence indicator curves seem to continue to indicate that this market lacks buyers, as their lines keep trending downward.
.002408, After Moving by 1.54%" width="1255" height="668" data-lazy-src="https://learn2.trade/wp-content/uploads/2023/05/AMPUSD_2023-05-24_20-48-46.png"/>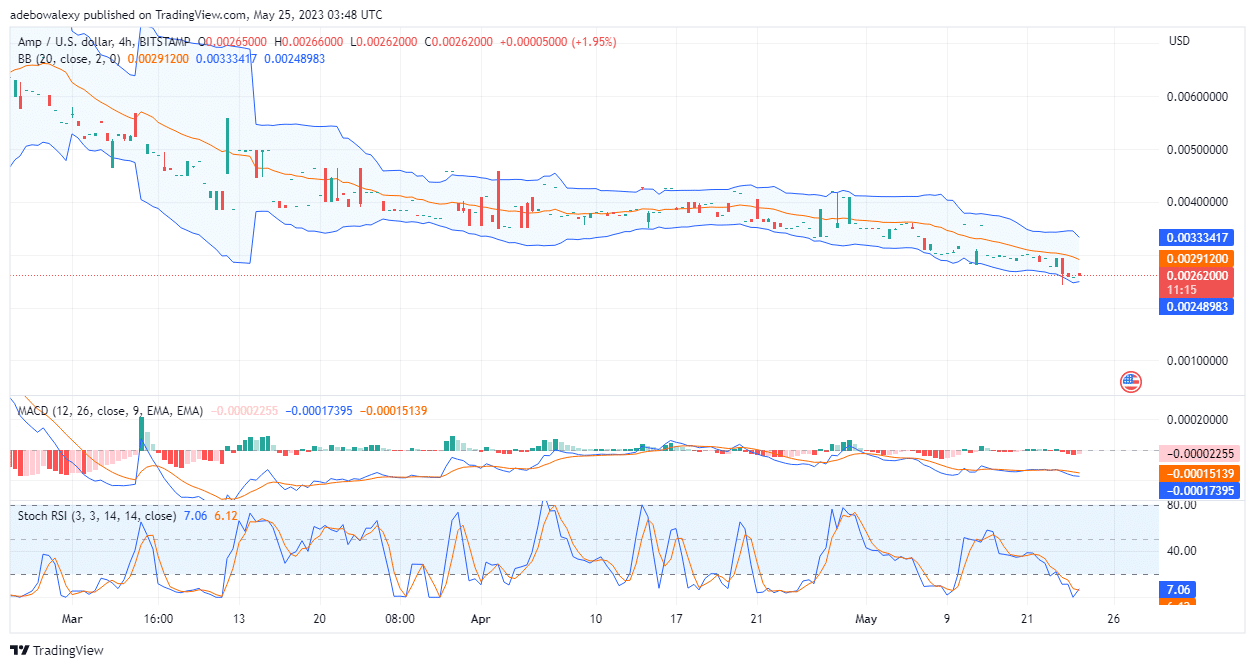
AMP/USD: Signs of Life Appear Too Weak
Meanwhile, on the AMP/USD 4-hour market, it appears that buyers are making some attempts to cause an upside retracement. The last red price candle seems to have retracted upwards above the previous green one. Also, the lines of the Relative Strength Index (RSI) indicator are now crossed to indicate a gain in bullish momentum. However, price action falls under the middle limit of the Bollinger Bands and is very close to the lowest band. In addition, the size of the price candles indicates that there is a shortage of buyers. Therefore, price action may fall below the $0.002550 price mark.
- Broker
- Min Deposit
- Score
- Visit Broker

- Award-winning Cryptocurrency trading platform
- $100 minimum deposit,
- FCA & Cysec regulated

- 20% welcome bonus of upto $10,000
- Minimum deposit $100
- Verify your account before the bonus is credited
- Fund Moneta Markets account with a minimum of $250
- Opt in using the form to claim your 50% deposit bonus
Learn to Trade
Never Miss A Trade Again

Signal Notification
Real-time signal notifications whenever a signal is opened, closes or Updated

Get Alerts
Immediate alerts to your email and mobile phone.

Entry Price Levels
Entry price level for every signal Just choose one of our Top Brokers in the list above to get all this free.