Don’t invest unless you’re prepared to lose all the money you invest. This is a high-risk investment and you are unlikely to be protected if something goes wrong. Take 2 minutes to learn more
The Akash Network token has experienced further upside retracements recently. This began when price action initially rebounded from the support level around $0.7500. However, the latest rebound has pushed the market through several key levels that could determine the continuation of further gains.
AKT Statistics
Current Price: $1.1188
Market Capitalization: $275.99M
Circulating Supply: 248.28M
Total Supply: 388.53M
CoinMarketCap Rank: 153
Key Price Levels
Resistance: $1.250, $1.500, $1.750
Support: $1.000, $0.750, $0.500
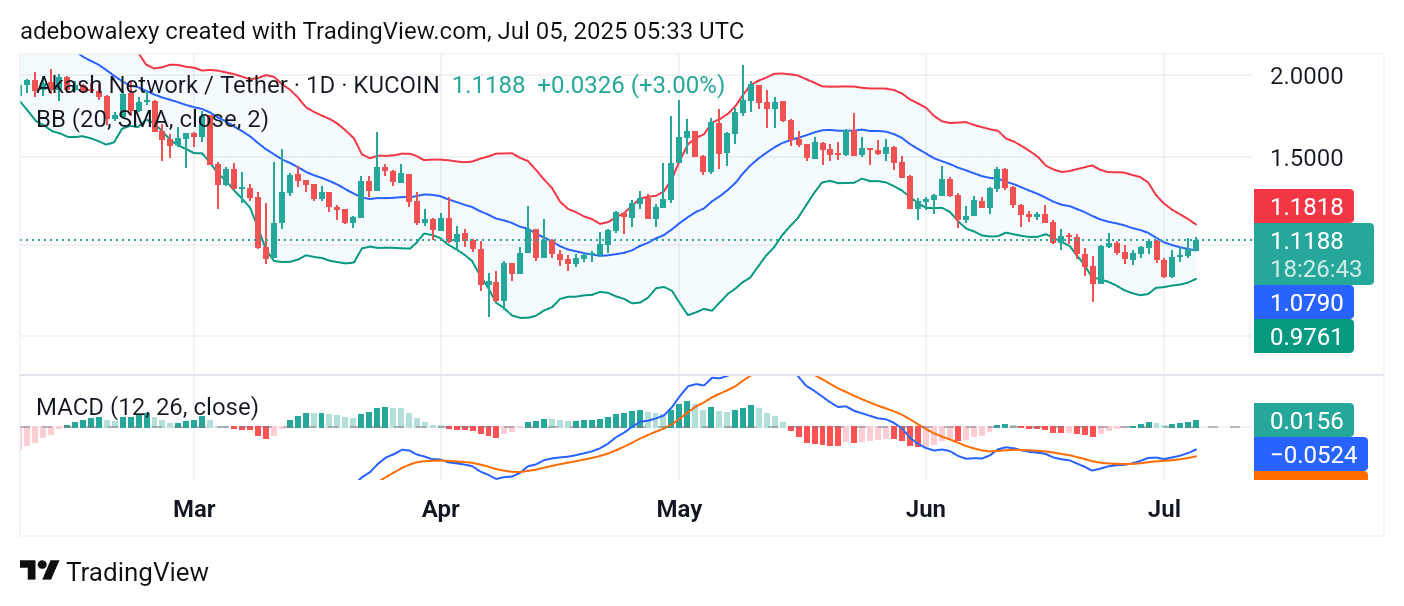
Akash Network Well Positioned to Extend Northwards
The AKT token has remained in the green for four consecutive sessions on the daily chart. Currently, the ongoing session is positioned just above the middle band of the Bollinger Bands (BB) indicator. However, the corresponding price candle appears to be contracting, as evidenced by the presence of an upper shadow. Still, its position above the middle BB band provides some short-term support.
Meanwhile, the Moving Average Convergence Divergence (MACD) indicator lines are rising steadily. The MACD histogram bars remain solid green and are growing taller above the equilibrium level, confirming that bullish momentum remains significant in this market.
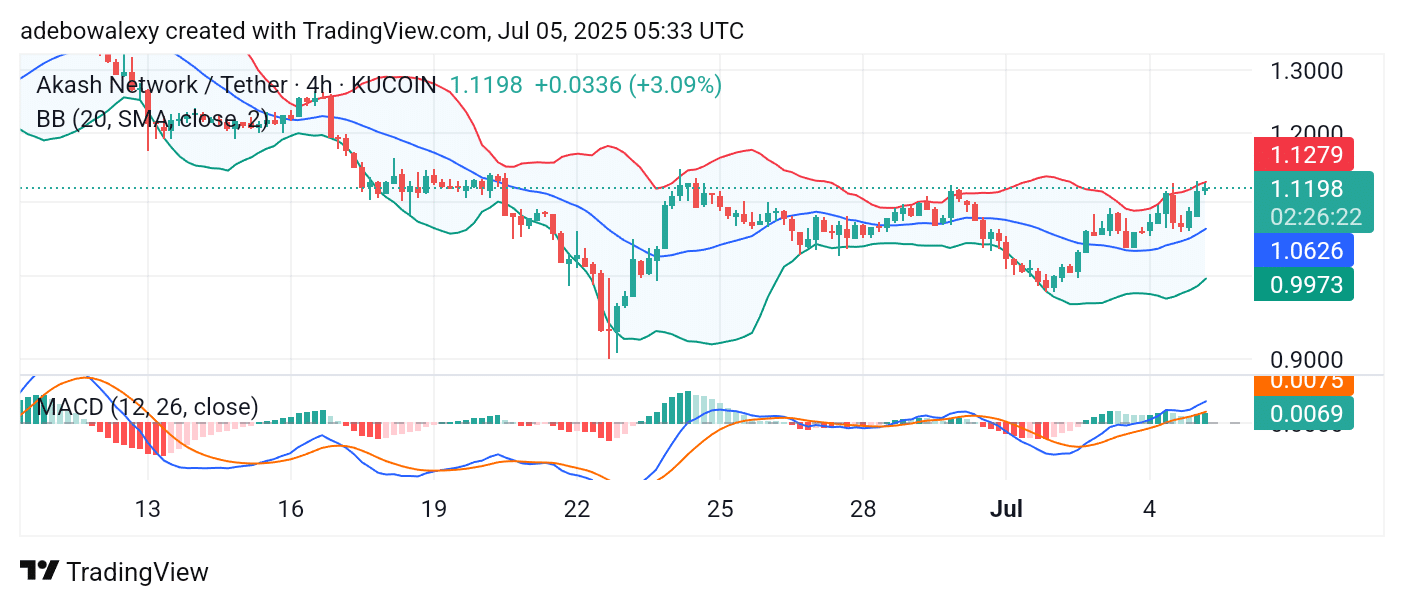
AKT Upside Retracement Remains Intact
Price action on the 4-hour chart of the Akash Network shows that the ongoing uptrend remains viable despite occasional pullbacks. As of the time of writing, the latest price candle is testing the upper limit of the BB indicator. Technically, this suggests that a short-term pullback may be imminent. However, the BB indicator itself shows an upward tilt toward its end, indicating an overall short-term bullish trend.
In addition, the MACD indicator has already crossed above the equilibrium level and maintains an upward trajectory. Consequently, this market may continue progressing toward the $1.250 price mark. Nonetheless, a brief pullback may occur, considering that price action has reached the upper boundary of the BB indicator.
Make money without lifting your fingers: Start trading smarter today
- Broker
- Min Deposit
- Score
- Visit Broker

- Award-winning Cryptocurrency trading platform
- $100 minimum deposit,
- FCA & Cysec regulated

- 20% welcome bonus of upto $10,000
- Minimum deposit $100
- Verify your account before the bonus is credited
- Fund Moneta Markets account with a minimum of $250
- Opt in using the form to claim your 50% deposit bonus
Learn to Trade
Never Miss A Trade Again

Signal Notification
Real-time signal notifications whenever a signal is opened, closes or Updated

Get Alerts
Immediate alerts to your email and mobile phone.

Entry Price Levels
Entry price level for every signal Just choose one of our Top Brokers in the list above to get all this free.