Buyers are gradually gaining ground in S&P 500 market
S&P 500 Price Analysis – 15 April
The S&P 500 can rise and enter the resistance levels of $5418, $5500, and $5595 if the $4813 position holds. The price may test the $4721 and $4613 possibilities if it breaches the $4813 support level.
Key Levels:
Resistance levels: $5418, $5500, $5595
Support levels: $4813, $4721, $4613
S&P 500 Long-term trend: Bearish
The S&P 500 Index’s daily chart is trending downward. For nearly two weeks, bears have controlled the market. Since February 19, the indicator’s main driver has been subtractions. On February 18, there was another attempt to reach the $55595 milestone; if the request is approved, more visitors are anticipated. By keeping the fixed price at the initial location mentioned, the suppliers were able to temporarily halt additional price increases, and the performance double-top bearish reversal map pattern held up at $55595. The S&P 500 drops to the $4813 barrier level from its $55595 position. Right now, the price is dropping close to $4813.
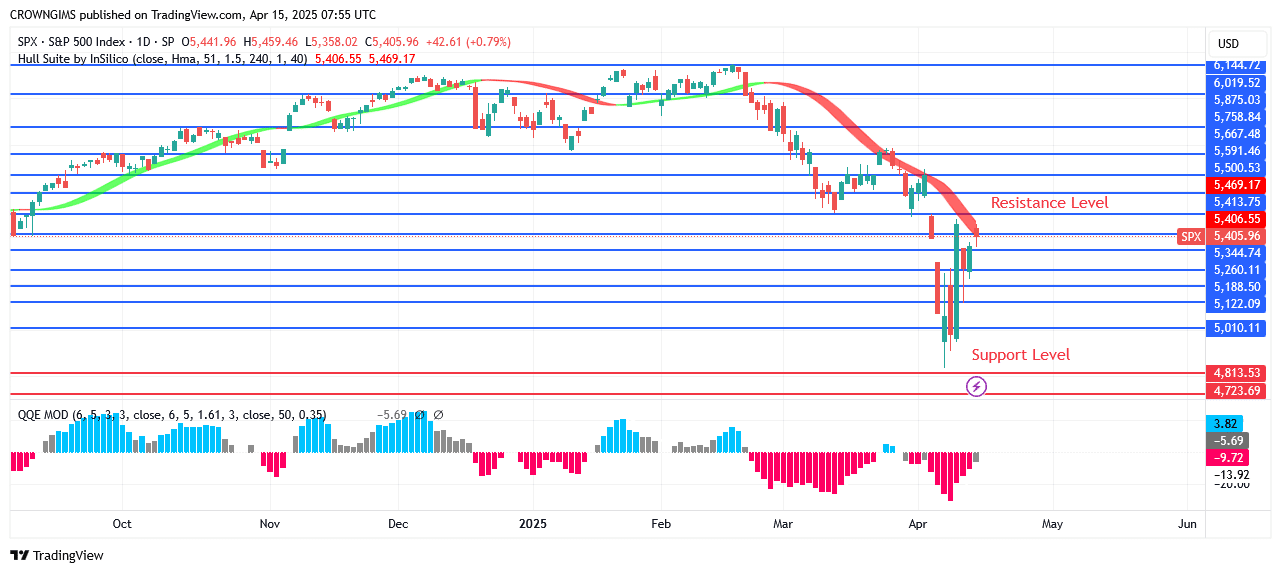
The S&P 500 can rise and enter the resistance levels of $5418, $5500, and $5595 if the $4813 position holds. The price may test the $4721 and $4613 possibilities if it breaches the $4813 support level. Both the Hull Suite crypto signals and the QQE MOD histogram indicate a sale. Everything might proceed as planned.
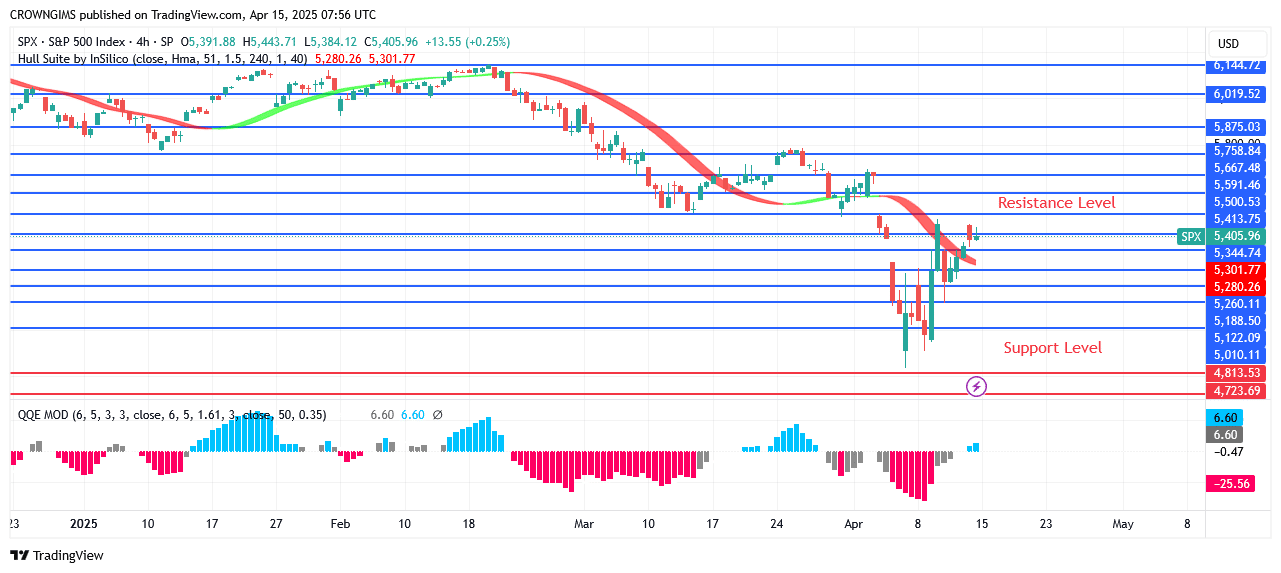
S&P 500 Medium-term Trend: Bearish
The 4-hour plot of the S&P 500 shows a decreasing trend. For the first week, the price has been unable to break above the $5595 hedge position due to the bears’ strong resistance. As the price has been falling, the bears have been steady at their assigned positions. Because of an engulfing candle pattern, the price is currently declining toward $4813. Since the S&P 500’s top of $5875, its price has been declining.
Start using a world-class auto trading solution
You can purchase Lucky Block – Guide, Tips & Insights | Learn 2 Trade here. Buy LBLOCK
- Broker
- Min Deposit
- Score
- Visit Broker

- Award-winning Cryptocurrency trading platform
- $100 minimum deposit,
- FCA & Cysec regulated

- 20% welcome bonus of upto $10,000
- Minimum deposit $100
- Verify your account before the bonus is credited
- Fund Moneta Markets account with a minimum of $250
- Opt in using the form to claim your 50% deposit bonus
Learn to Trade
Never Miss A Trade Again

Signal Notification
Real-time signal notifications whenever a signal is opened, closes or Updated

Get Alerts
Immediate alerts to your email and mobile phone.

Entry Price Levels
Entry price level for every signal Just choose one of our Top Brokers in the list above to get all this free.