Don’t invest unless you’re prepared to lose all the money you invest. This is a high-risk investment and you are unlikely to be protected if something goes wrong. Take 2 minutes to learn more
In recent times, following the steep downward correction that occurred in the 0x Protocol daily market, price action has lacked the strength to stage any significant movement. Nevertheless, let’s see what today’s trading activity has in store.
ZRX Statistics:
Current 0x Value: $0.5801
ZRX Market Cap: $486,799,825
0x Circulating Supply: 847,496,055
ZRX Total Supply: 1 billion
0x CoinMarketCap Rank: 145
Key Price Levels:
Resistance: $0.6000, $0.8000, and $1.000
Support: $0.5000, $0.3000, and $0.1000
.6000 Mark" width="580" height="265" data-lazy-src="https://learn2.trade/wp-content/uploads/2024/05/ZRXUSDT_2024-05-23_05-21-51_052452-1024x467.png"/>
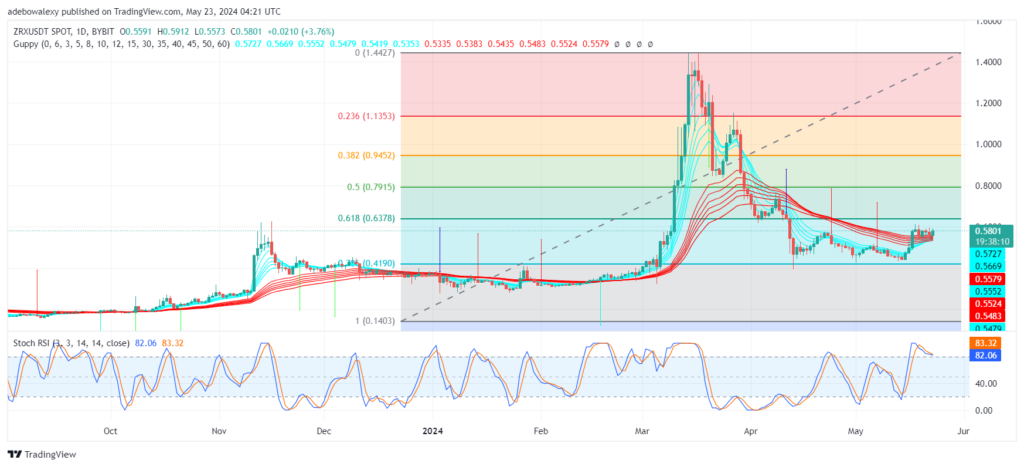
Price Action in the ZRX Approaches Medium-term Resistance
The 0x Protocol price movement is making another attempt to forge ahead. The market has been hovering around the Guppy Multiple Moving Average (GMMA) lines for a while. Nevertheless, price action has failed to gather much bullish momentum to move on from there.
Meanwhile, today’s trading seems like an attempt to rise upward from the baseline found above the GMMA indicator lines. The Stochastic Relative Strength Index (SRSI) has reached the overbought region but now trends slightly downward. However, the terminal part of this indicator line seems to be approaching a crossover. This may eventually deliver more momentum to price movement in this market.
.6000 Mark" width="580" height="265" data-lazy-src="https://learn2.trade/wp-content/uploads/2024/05/ZRXUSDT_2024-05-23_05-22-39_052450-1024x467.png"/>
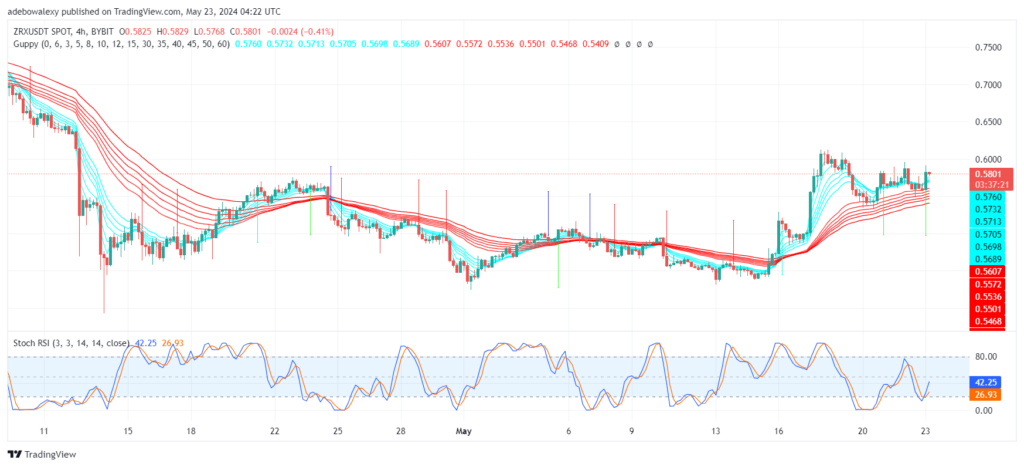
The headwind in the 0x Protocol Market Sees a Minimal Downward Correction
While hopes of ZRX price action bursting through the resistance formed by the $0.6000 mark remain, it seems that headwinds are already standing against the trend. The previous session raised the market above the GMMA indicator lines, while the ongoing session started with a rejection.
The last price candle on this chart shows headwinds attempting to restrict any upward movement. Nevertheless, the position of the market above the GMMA still gives bullish traders hope of shaking off the rejection. Also, the SRSI indicator lines are trending upward, suggesting that traders may stick to crypto signals targeting the $0.7000 mark.
Trade on MT4 with Leverage up to 1:500! Trade on MT4 with Leverage up to 1:500!
X
We use cookies to ensure that we give you the best experience on our website. If you continue to use this site we will assume that you are happy with it.
 .6000 Mark" width="580" height="265" data-lazy-src="https://learn2.trade/wp-content/uploads/2024/05/ZRXUSDT_2024-05-23_05-21-51_052452-1024x467.png"/>