NAS100 Shows Signs Of Bullish Recovery From Key Support
NAS100 Analysis – March 23 NAS100 is showing signs of a bullish recovery from a key support level. The 9-day SMA currently stands at…
NAS100 Analysis – March 23 NAS100 is showing signs of a bullish recovery from a key support level. The 9-day SMA currently stands at…
NAS100 Analysis – March 16 NAS100 shows a positive turnaround from a crucial support area of $19,000. The 9-day Simple Moving Average (SMA) is…
NAS100 Analysis – March 2 NAS100 exhibits bearish momentum with a potential correction before continuation. The 9-day SMA at $21,470 currently acts as dynamic…
NAS100 Analysis – February 23 NAS100 is experiencing a pullback before a potential bullish continuation toward higher levels. Technical indicators suggest this retracement is…
NAS100 Analysis – February 16 NAS100 exhibits strong bullish momentum, with indicators supporting the uptrend. The SMA-9 at $21,760 is trending upwards, providing dynamic…
NAS100 Analysis – February 9 NAS100 continues to exhibit bullish momentum but remains susceptible to a potential correction. The index maintains an overall uptrend,…
NAS100 Analysis – February 3 NAS100 finds support, signaling a potential bullish reversal in the coming days. Technical indicators suggest a shift in momentum…
NAS100 Analysis – January 26 NASDAQ100 targets bullish momentum amid key resistance levels. Indicators on the NAS100 daily chart highlight strong bullish momentum. The…
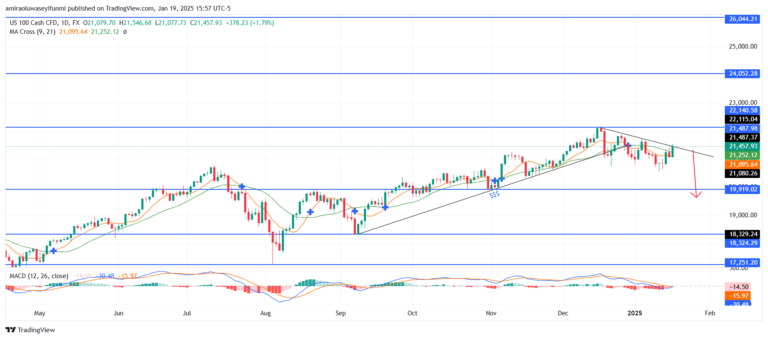
NAS100 Analysis – January 19 NAS100 exhibits bearish momentum with possible further declines as the price keeps respecting the falling trendline. The Moving Average…