
Lucky Block Price Forecast – Expert Analysis & Trading Tips | Learn 2 Trade – Expert Analysis & Trading Tips | Learn 2 Trade – January 3
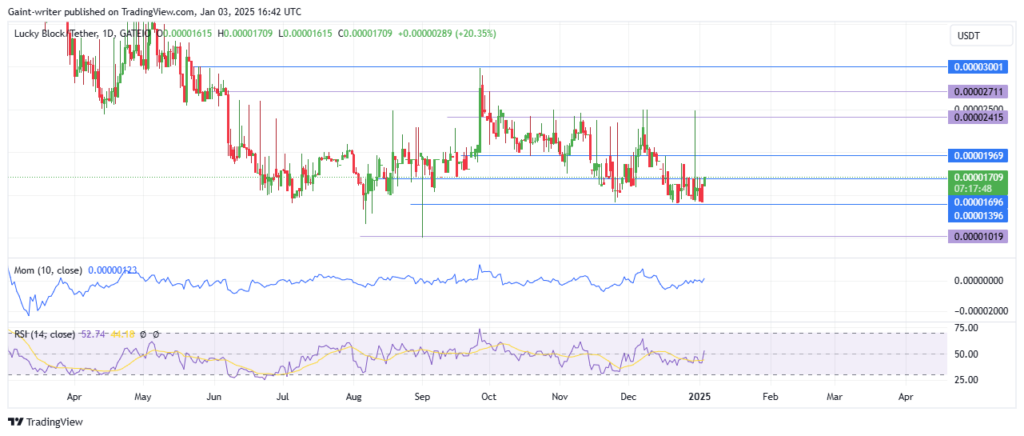
The Lucky Block price forecast indicates a strong bullish momentum as buyers break out of a prolonged consolidation zone, pushing the price beyond the $0.00001700 key level.
Lucky Block Long Term Trend: Bullish (Daily Chart)
Key Levels
Support Levels: $0.00001600, $0.00001500
Resistance Levels: $0.00001960, $0.00002050 After several days of consolidation last month, Lucky Block buyers have regained control, driving the price above the $0.00001700 level. The bulls are now eyeing the $0.00001960 resistance zone as their next target. A decisive break above this level could pave the way for further bullish momentum, marking a significant shift in market dynamics.
Lucky Block Price Forecast – Expert Analysis & Trading Tips | Learn 2 Trade – Expert Analysis & Trading Tips | Learn 2 Trade – LBLOCKUSD Outlook
The Momentum indicator on the daily chart shows increasing buy pressure, while the Relative Strength Index (RSI) continues to rise, reflecting growing bullish sentiment. These indicators suggest the potential for significant gains in the coming weeks.
If buyers sustain their momentum and successfully breach the $0.00001960 resistance, the price could target $0.00002050 and possibly higher levels over the long term. Consistent buying pressure would reinforce the bullish trend, drawing more interest from market participants.
However, if buyers fail to break above $0.00001960, the market may consolidate around $0.00001700. In this scenario, buyers would need to regroup before attempting another breakout. Traders can leverage crypto signals to identify optimal entry and exit points while monitoring key indicators like the Momentum and RSI to confirm sustained bullish activity.
Lucky Block Medium Term Trend: Bullish (4-Hour Chart)
On the 4-hour chart, buyers are maintaining strong upward momentum, supported by bullish signals from both the Momentum indicator and RSI. These indicators suggest that further gains are likely in the medium term. If the bullish push continues, Lucky Block could climb toward $0.00001850, with a subsequent test of the $0.00001960 resistance zone. Should momentum waver, the market may enter a consolidation phase near $0.00001700 before resuming its upward trajectory.
How To Buy Lucky Block
Note: Learn2.trade is not a financial advisor. Do your research before investing your funds in any financial asset, product, or event. We are not responsible for your investment results.


