

Uniswap Price Analysis – April 21
When the support level of $7.6 is broken downside, price level may decrease to $3 and $2 support levels. In case the bulls were able to defend the support level of $7, Uniswap may bounce up towards the resistance levels of $9, $12 and $13.
UNI/USD Market
Key Levels:
Resistance levels: $9, $12, $13
Support levels: $7 $3, $2
UNI/USD Long-term Trend: Bearish
On the long-term outlook Uniswap is bearish. Sellers refuse to let Uniswap go, more bearish candles are producing and the price is going down accordingly. Last week, the crypto is trying to produce a double bottom chart pattern. The buyers of Uniswap were set to push up the price. It started increasing towards the $12 resistance levels where it experienced a fake breakout. An evening star chart pattern emerged as a bearish movement symbol. The bears opposes the price increase and it is currently facing the support level of $7.
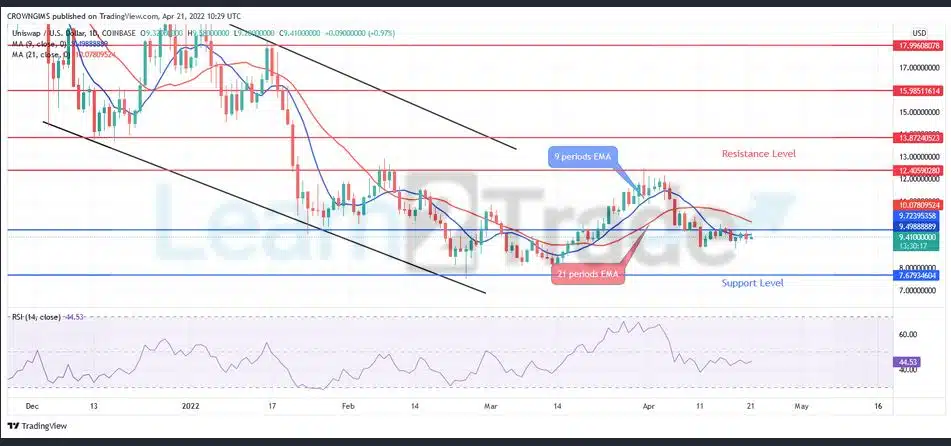
Uniswap is trading below the 9 periods EMA and 21 periods EMA which indicates an increase in bearish momentum. The fast moving average (9 periods EMA) has crossed the slow moving average (21 periods EMA) downside. When the support level of $7.6 is broken downside, price level may decrease to $3 and $2 support levels. In case the bulls were able to defend the support level of $7, Uniswap may bounce up towards the resistance levels of $9, $12 and $13. The Relative Strength Index is bending down at 41 levels which indicate a sell signal.
UNI/USD Medium-term Trend: Ranging
On the 4-hour chart, Uniswap is ranging. The bears opposed the price increase which started two weeks ago. The bulls lose momentum at $12 price level and the bears took over the market. The crypto decreases and break down $9 level. It is currently consolidating at the just mentioned level.

Uniswap is trading around the 9 periods EMA and 21 periods EMA, the relative strength index period 14 is at 48 levels bending down to indicate sell signal.
You can purchase Lucky Block here: Buy LBlock


