

Price activity in the SuperVerse daily market has been edging higher since the previous session. However, as of the time of writing, the coin holds a price increase of 4.81%. Let’s take a closer look at the market below.
SUPER Statistics
Current Price: $0.1993
Market Capitalization: $124.35M
Circulating Supply: 637.16M
Total Supply: 999.99M
CoinMarketCap Rank: 197
Key Levels
Resistance: $0.2000, $0.2500, $0.3000
Support: $0.1900, $0.1500, $0.1250
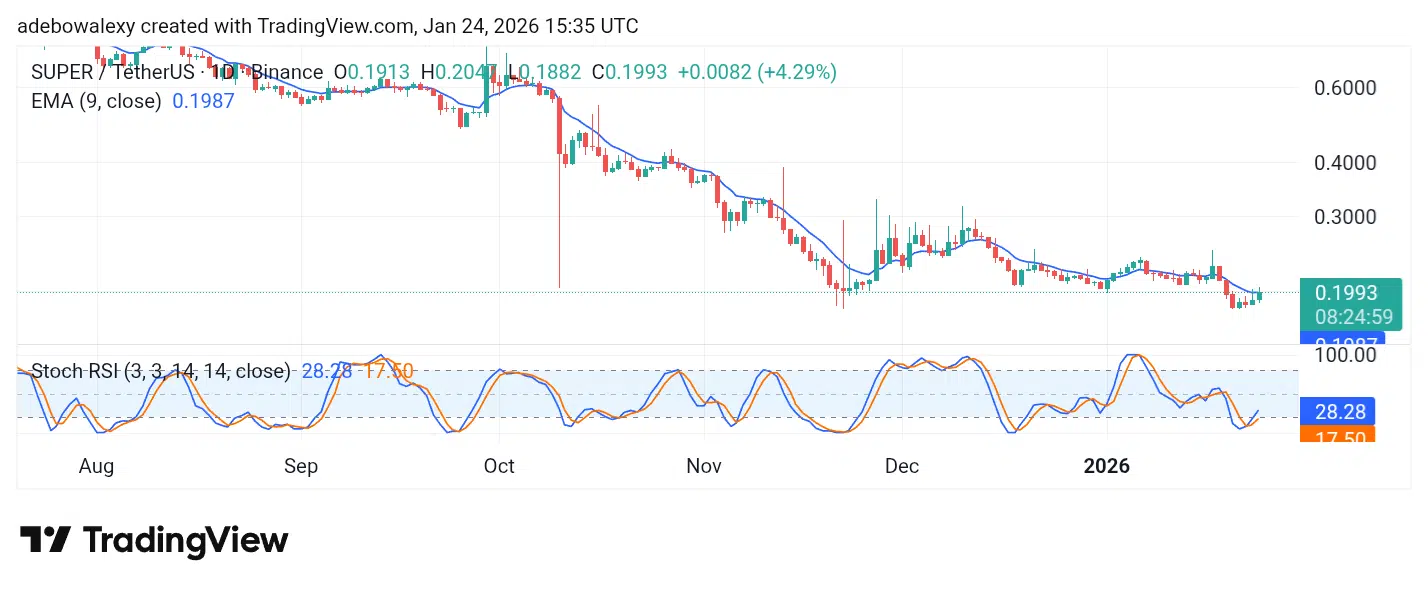
SuperVerse Experiences Opposition at the 9-Day EMA
Price action on the SUPER daily chart can be seen rising steadily from below the 9-day Exponential Moving Average (EMA) line. The most recent price candle has moved above the 9-day EMA curve but has faced notable pushback from headwinds. Despite this, the candle remains green, keeping the token’s price above the 9-day EMA line.
One Life, One Chance
You only get one life, and that alone makes it worth taking a chance. Trying may not promise success, but it always offers growth and clarity. In the end, an attempt is far better than living with regret.
one life, its worth an attempt pic.twitter.com/YwvOlJOf1L
— SuperVerse (@SuperVerse) January 24, 2026
SuperVerse Experiences Opposition at the 9-Day EMA ( Continued)
The Stochastic Relative Strength Index (SRSI) indicator lines are still within the oversold region but continue on an upward trajectory. Technically, this suggests that bullish forces are encountering considerable resistance.

SUPER Upside Movement Stays Steady but May Soon See a Pullback
Even on shorter time frames, price action remains steadily bullish. Over the past four sessions, price movement has continued upward, albeit at a modest pace. The latest price candle remains green and stands above the 9-day Exponential Moving Average line.
SuperVerse SUPER to $0.95!
At $0.95, further downside movement may be seen before an upward rebound.
SUPER Upside Movement Stays Steady but May Soon See a Pullback (continued)
Meanwhile, the SRSI indicator lines are converging near the 100 level, although a downward crossover has not yet occurred. Consequently, this suggests that price action may experience a pullback soon.
However, should the price remain above the 9-day EMA curve, the upside trend may continue toward the $0.2500 price level.
Make money without lifting your fingers: Start trading smarter today


