
Lucky Block – Guide, Tips & Insights | Learn 2 Trade Price Forecast – Expert Analysis & Trading Tips | Learn 2 Trade – Expert Analysis & Trading Tips | Learn 2 Trade – December 24
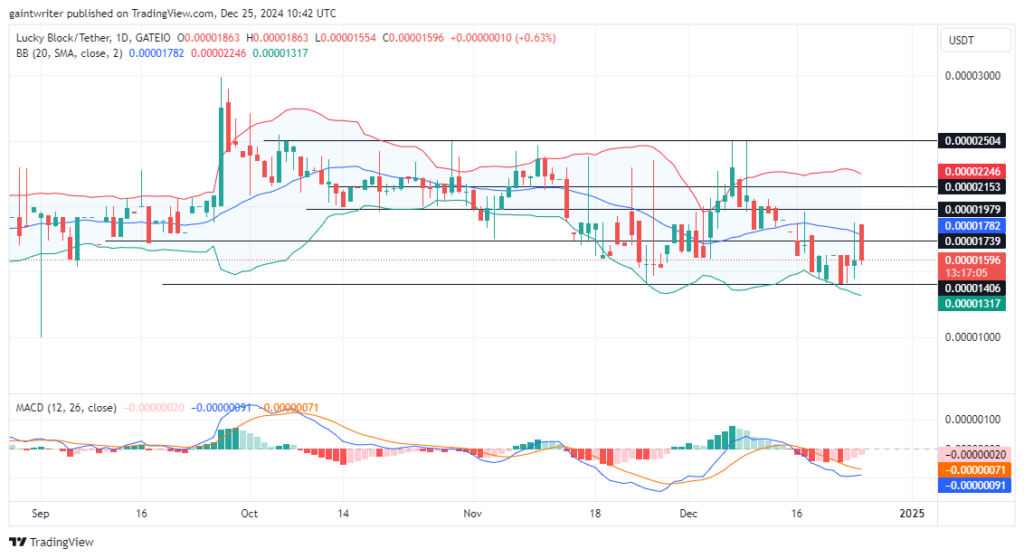
The Lucky Block – Guide, Tips & Insights | Learn 2 Trade price forecast reveals that buyers are making a concerted effort to gain control, driving the price beyond the critical $0.00001560 level.
Lucky Block – Guide, Tips & Insights | Learn 2 Trade Long-Term Trend: Bullish (Daily Chart)
Key Levels
Support Levels: $0.00001560, $0.00001390
Resistance Levels: $0.00001970, $0.00002500  Lucky Block – Guide, Tips & Insights | Learn 2 Trade buyers have regained momentum after the price retraced to the $0.00001390 support zone earlier this month. The market is now experiencing a gradual recovery, with buyers setting their sights on the $0.00001970 resistance level as their next objective.
Lucky Block – Guide, Tips & Insights | Learn 2 Trade Price Forecast – Expert Analysis & Trading Tips | Learn 2 Trade – Expert Analysis & Trading Tips | Learn 2 Trade – LBLOCKUSD Outlook
The Bollinger Band indicator on the daily chart points to stable market volatility, allowing buyers to continue their upward push. Additionally, the MACD (Moving Average Convergence and Divergence) is rising from negative territory, indicating strengthening bullish momentum. A move above the middle Bollinger Band further supports the buyers’ position and signals the potential for sustained gains.
As bullish momentum builds, the $0.00001970 resistance level becomes the next significant hurdle. A breakthrough at this level could drive the price toward $0.00002500, placing buyers in a dominant market position.
Nevertheless, persistent sell pressure could hinder the bullish advance. To maintain control, buyers must sustain their current momentum. Indicators like the MACD and Bollinger Bands suggest a positive trajectory, with crypto signals hinting at continued bullish strength if buyers remain consistent.
Lucky Block – Guide, Tips & Insights | Learn 2 Trade Medium-Term Trend: Bullish (4-Hour Chart)
On the shorter time frame, buyers continue to demonstrate resilience despite intermittent sell-offs. The MACD on the 4-hour chart reflects positive momentum, while the price trend steadily climbs.  If buyers maintain their pressure, Lucky Block – Guide, Tips & Insights | Learn 2 Trade could reach the $0.00001850 zone in the medium term, positioning it closer to the $0.00001970 resistance level.
How To Buy Lucky Block – Guide, Tips & Insights | Learn 2 Trade
Note: Learn2.trade is not a financial advisor. Do your research before investing your funds in any financial asset, product, or event. We are not responsible for your investment results.
- Broker
- Min Deposit
- Score
- Visit Broker

- Award-winning Cryptocurrency trading platform
- $100 minimum deposit,
- FCA & Cysec regulated

- 20% welcome bonus of upto $10,000
- Minimum deposit $100
- Verify your account before the bonus is credited


- Fund Moneta Markets account with a minimum of $250
- Opt in using the form to claim your 50% deposit bonus


