Lucky Block – Guide, Tips & Insights | Learn 2 Trade Price Forecast – Expert Analysis & Trading Tips | Learn 2 Trade – Expert Analysis & Trading Tips | Learn 2 Trade – May 24
The Lucky Block – Guide, Tips & Insights | Learn 2 Trade price forecast of $0.00280 is the next target of the bulls. There has been a double test of the $0.00280 level due to the pull of price.
LBLOCK/USD Long-Term Trend: Bullish (30-Minute Chart)
Key Levels:
Supply Zones: $0.00280, $0.00230.
Demand Zones: $0.00180, $0.00130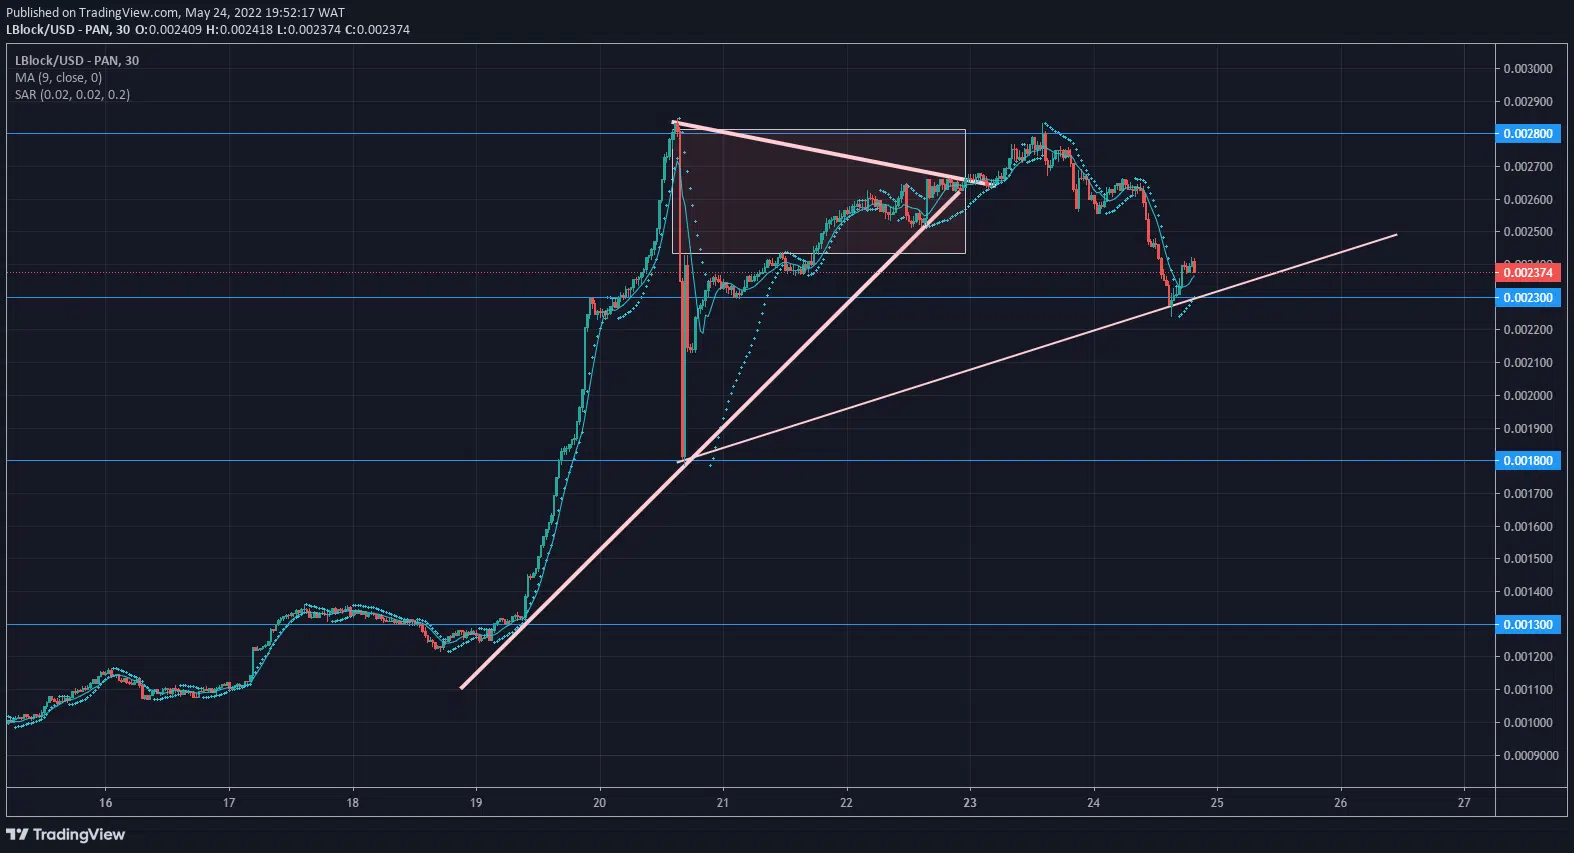
Lucky Block – Guide, Tips & Insights | Learn 2 Trade Price Forecast – Expert Analysis & Trading Tips | Learn 2 Trade – Expert Analysis & Trading Tips | Learn 2 Trade: LBLOCK/USD Outlook
The market crawled up to fill the gap between $0.00280 and $0.00230. The bulls have shown a willingness to break through the resistance level at $0.00280. The supply zone has been tested twice by the bulls.
The bulls seem persistent in their willingness to ascend further beyond $0.00280. The Moving Averages have switched their position to support bullishness at the $0.00230 demand zone.
A shadow formed below the last candle at the $0.00230 support level. Multiple bullish candles have formed after the support level was struck. The Parabolic SAR (Stop and Reverse) has also signified a new bullish run.
Medium-Term Trend: Bullish (5-minute chart)
The 5-minute chart shows a change in market direction. A bullish breakout is prominent in the lower timeframe.
How To Buy Lucky Block – Guide, Tips & Insights | Learn 2 Trade
Note: Learn2.trade is not a financial advisor. Do your research before investing your funds in any financial asset or presented product or event. We are not responsible for your investing results.
- Broker
- Min Deposit
- Score
- Visit Broker

- Award-winning Cryptocurrency trading platform
- $100 minimum deposit,
- FCA & Cysec regulated

- 20% welcome bonus of upto $10,000
- Minimum deposit $100
- Verify your account before the bonus is credited


- Fund Moneta Markets account with a minimum of $250
- Opt in using the form to claim your 50% deposit bonus