

Lucky Block Price Forecast – Expert Analysis & Trading Tips | Learn 2 Trade – Expert Analysis & Trading Tips | Learn 2 Trade – May 27
The Lucky Block price forecast is for the continuation of the ascending market with the aid of the bullish trendline.
LBLOCK/USD Long-Term Trend: Bullish (30-Minute Chart)
Key Levels:
Supply Zones: $0.002830, $0.001360
Demand Zones: $0.00790, $0.002140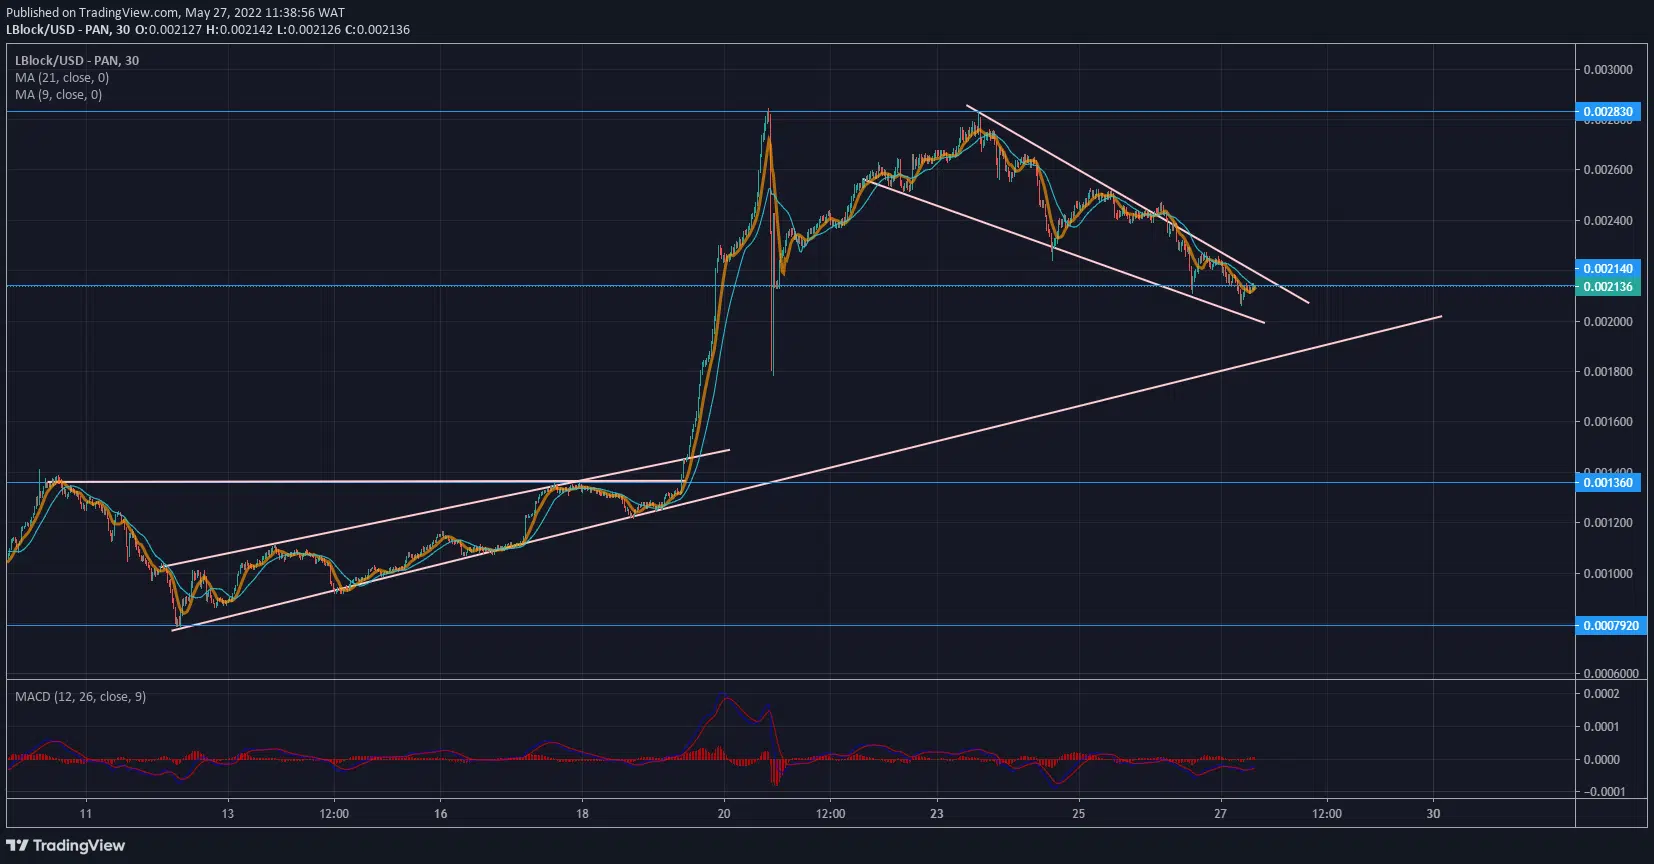
Lucky Block Price Forecast – Expert Analysis & Trading Tips | Learn 2 Trade – Expert Analysis & Trading Tips | Learn 2 Trade: LBLOCK/USD Outlook
LBLOCK/USD bounced back and forth within an ascending channel from the 12th to the 19th of May. The market faced resistance at the $0.001360 resistance level on the 17th of May. On the 19th of May, the Moving Averages for periods nine and twenty-one crossed on the bullish trend line to signify bullishness. The MACD (Moving Average Convergence Divergence) also crossed below the zero point in the indicator phase.
The ascending trend line provided sufficient support to break the resistance at $0.001360. The bullish breakout caused a rapid rise in Lucky Block’s value. The buying pressure didn’t give room for a retest of the ascending channel before the takeoff of the bulls.
The market faced resistance at $0.2830. The resistance level was tested twice after the bullish surge. The market is currently descending through a creek to find support for a bullish breakout of $0.002830.
Medium-Term Trend: Bullish (5-minute chart)
The market is currently driving towards the bullish trend line to find support. Opportunities exist for scalpers to take advantage of the gyration within the creek. 
How To Buy Lucky Block
Note: Learn2.trade is not a financial advisor. Do your research before investing your funds in any financial asset or presented product or event. We are not responsible for your investing results.


