

Lucky Block Market Prediction – Expert Analysis & Trading Tips | Learn 2 Trade – April 12
The Lucky Block market prediction is for the market to continue its slide towards the bullish confluence of the upper border of its former channel and the strong $0.00222220 support level.
LBLOCK/USD Long-Term Trend: Bullish (30-Minute Chart)
Key Levels:
Supply Zones: $0.00378260, $0.00324440, $0.00272320
Demand Zones: $0.00272320, $0.00246460, $0.00222220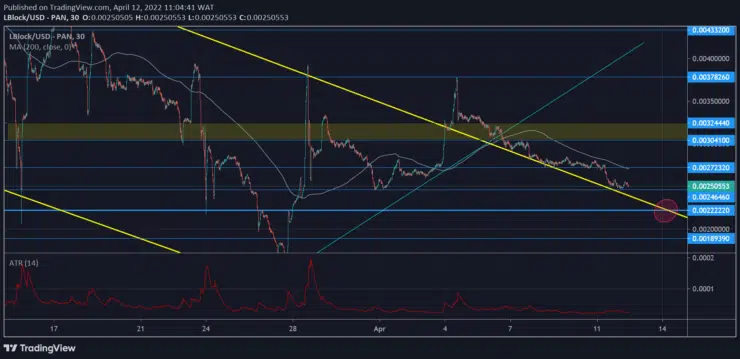
Lucky Block Market Prediction – Expert Analysis & Trading Tips | Learn 2 Trade: LBLOCK/USD Is Looking To Bounce up From a Confluence
Lblock was previously sliding down through a descending channel. The $0.00222220 proved to be a resilient support level during the price drop as it was breached only once.
The price broke out of the channel after consolidating between the $0.00304100 resistance level and $0.00246460. Due to exhaustion, the L-block has continued sliding down on top of the channel’s border.
The coin is now approaching a confluence zone where the channel’s border and the $0.00222220 cross. Low volatility has characterized the market up till now, as shown by the ATR (Average True Range) indicator. But that could change when the confluence triggers bullishness.
LBLOCK/USD Medium-Term Trend: Bullish (5-minute chart)
The market is ranging between the channel’s border and the MA period 200 (Moving Average) on the 30-minute chart as the price drops. This is similar to the 5-minute chart, but the MA period 200 is closer to the candles, putting pressure on it to break below the $0.00246460 level.
How To Buy Lucky Block
Note: Learn2.trade is not a financial advisor. Do your research before investing your funds in any financial asset or presented product or event. We are not responsible for your investing results.


