Key Highlights
Solana faces further decline
The altcoin finds support above $175
Solana (SOL) Current Statistics
The current price: $194.33
Market Capitalization: $106,091,529,316.18
Trading Volume: $7,420,700,942.92
Major supply zones: $220, $240, $260
Major demand zones: $120, $100, $80
Solana (SOL) Price Long-Term Prediction: Bearish
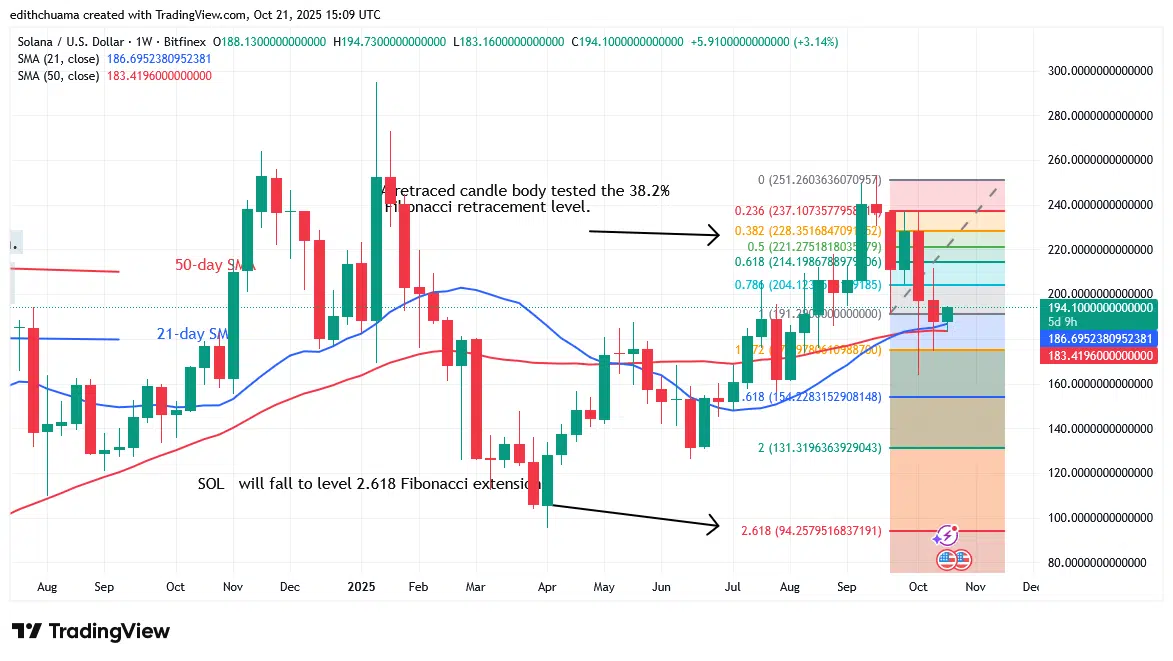
The price of Solana dropped to $164 as it faces the $200 barrier. The bulls bought dips on the 4-hour chart and started moving sideways. On the weekly chart, bulls took advantage of the dips, but the negative trend stopped above the moving average lines. According to the price indication, the altcoin will continue to fall in value.
Currently, the cryptocurrency price has found support above the moving average lines. Solana is expected to fall to the level 2.618 Fibonacci extension or $94.25 if the bears push the price below the moving average lines. Solana is currently trading at $194.
Solana (SOL) Price Indicator Analysis
On the weekly chart, the price bars are higher than the horizontal moving average. Long candlestick tails point below the moving average lines, indicating significant buying pressure. On the 4-hour chart, the price bars are above the downward-sloping moving average lines. The crypto price has made an upward correction and is now under selling pressure.
What Is the Next Move for Solana (SOL)?
Solana’s price is still moving sideways as it faces the $200 barrier. The altcoin is trading in a range above the $175 support and below the $210 resistance level. Today, the cryptocurrency price broke above the moving average lines but was held near the $200 high. The altcoin is falling as it confronts rejection at its recent peak. Solana will fall if it loses its $175 support.

Make money without lifting your fingers: Start using a world-class auto trading solution.
Note: Learn2.Trade is not a financial advisor. Do your research before investing your funds in any financial asset, product, or event. We are not responsible for your investment.