

Bitcoin SV Price Analysis – December 06
Further increase in the bears’ pressure will decrease the price to break down the support level of $113 which may expose the price to $73 and $41 price level. In case the support level of $113 holds, the price may increase towards the resistance level at $148, $171 and $194.
Key Levels:
Resistance levels: $148, $171, $194
Support levels: $113, $73, $41
BSV/USD Long-term Trend: Bearish
On the daily chart, Bitcoin SV is bearish. Last week, the coin was on the ranging movement in the daily chart. The former support level at $148 holds and the bearish momentum is not enough to push the price below it. The former resistance level at $194 remains strong to the bulls. On December 03, the bears increase their momentum and push down the price below the support level of $113 and it was approaching the $73 support level. The bears immediately reacted against it and the price pulled back below $148 level.
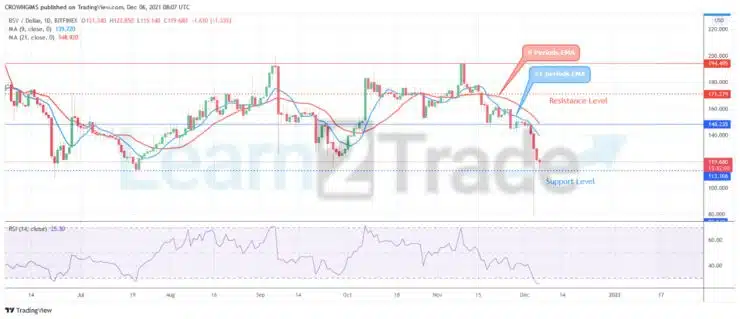
The two EMAs are bending down to follow the direction of the price. The crypto continue its trading below the 9 periods EMA and the 21 periods EMA which indicate bearish momentum. Further increase in the bears’ pressure will decrease the price to break down the support level of $113 which may expose the price to $73 and $41 price level. In case the support level of $113 holds, the price may increase towards the resistance level at $148, $171 and $194.
BSV/USD Medium-term Trend: Bearish
Bitcoin SV is on the bearish movement on the medium-term outlook. The bears eventually dominates the Bitcoin SV market. The momentum of the bears increases and the price decline to break down the support level at $148. The price is struggling to break down the support level of $113.

The price is trading below the 9 periods EMA and 21 periods EMA which indicate that bears are in control of the market. The relative strength index period 14 is at 30 levels displaying a bearish signal.
You can purchase crypto coins here. Buy Tokens


