
Polkadot (DOT) Price Long-term Trend: Bullish
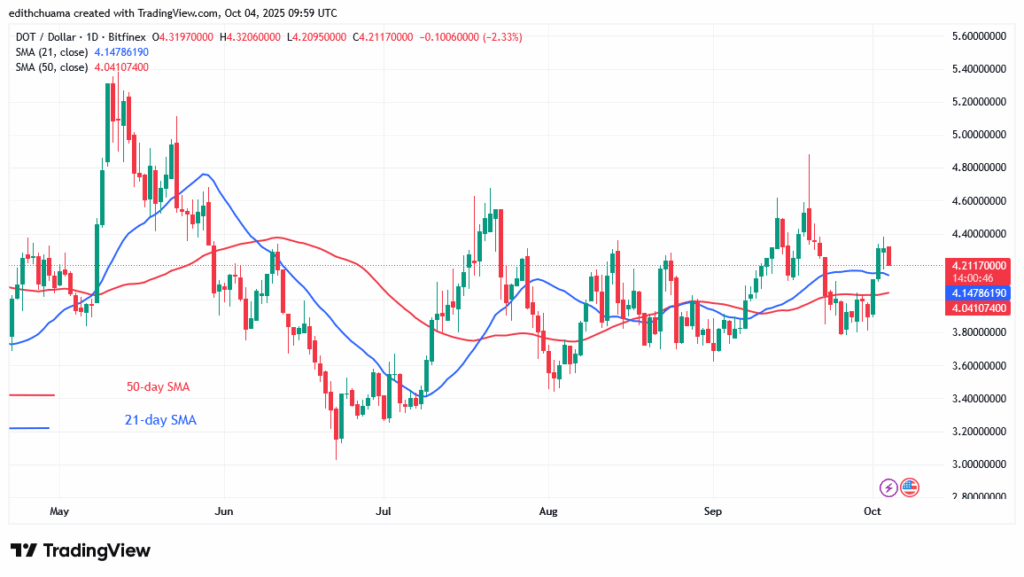
The price of Polkadot (DOT) rises above the moving average lines but retraces to its vital support. The bullish momentum peaked at $4.37 but was unable to surpass the $4.40 high. The crypto asset has retraced and is currently sitting above the 21-day SMA support. Polkadot will advance to a high of $4.60 if bullish momentum continues and it breaks above the $4.40 barrier.
However, if the altcoin continues to fall and breaks below the 21-day SMA, it will fall to the critical support level of $4.00. Meanwhile, the crypto asset is trading above the 21-day SMA support as the trend is being determined. DOT is currently trading at $4.20 as of the time of writing.

Technical indicators:
Key Resistance Levels: $10, $12, $14
Key Support Levels: $5, $3, $1
Polkadot Indicator Analysis
The DOT price has rebounded above the moving average lines. The 21-day SMA slopes horizontally above the 50-day SMA support. On the 4-hour chart, the moving average lines are sloping higher, indicating the present bullish trend.
General Outlook for Polkadot (DOT)
Polkadot’s bullish advance halts at its current high but retraces to its vital support. The cryptocurrency price surged twice to a high of $4.40 before returning to its downward trend. On the 4-hour chart, the bearish trend has crossed below the 21-day SMA. This means that the selling pressure will continue to the bottom above the 50-day SMA, or $4.00 low.

Make money without lifting your fingers: Start using a world-class auto trading solution.
Note: Learn2.Trade is not a financial advisor. Do your research before investing your funds in any financial asset, product, or event. We are not responsible for your investment.


