

Lucky Block Price Forecast – Expert Analysis & Trading Tips | Learn 2 Trade – Expert Analysis & Trading Tips | Learn 2 Trade – December 6
Lucky Block price forecast suggests buyers are determined to sustain momentum and push for further market expansion.
Lucky Block Long-Term Trend: Bullish
Key Levels
Support Levels: $0.00002100, $0.00001850
Resistance Levels: $0.00002350, $0.00002500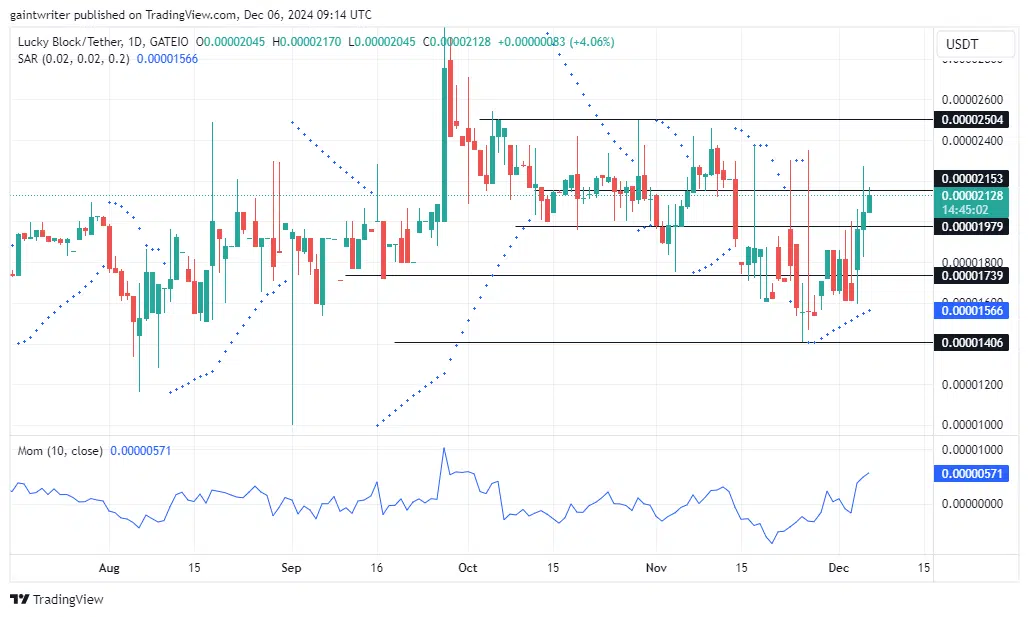
Lucky Block Price Forecast – Expert Analysis & Trading Tips | Learn 2 Trade – Expert Analysis & Trading Tips | Learn 2 Trade – LBLOCKUSD Outlook
The transition from November’s low of $0.00001400 to December’s rally underscores the buyers’ ability to regain control and sustain momentum for further price gains. The Momentum indicator supports this outlook, suggesting room for continued expansion.
Although there has been a slight pullback, the Momentum indicator continues to reflect optimism. This dip could indicate a reaccumulation phase, setting the stage for bulls to target higher liquidity zones.
The Parabolic SAR aligns with the bullish trend, positioning below the price action and signaling sustained upward movement. This confirms that buyers remain in control, with the potential for further gains. Additionally, the market has left a narrow fair value gap between $0.00002050 and $0.00002100, which could attract more buying interest as participants aim to fill this inefficiency before the rally resumes.
Lucky Block Medium Term Trend: Bullish (4-Hour Chart)
On shorter time frames, Lucky Block buyers continue to consolidate near the $0.00002150 level, preparing for a breakout toward $0.00002350. The consolidation within a narrow range indicates buyers are stacking positions.
How To Buy Lucky Block
Note: Learn2.trade is not a financial advisor. Do your research before investing your funds in any financial asset, product, or event. We are not responsible for your investment results.


