
Lucky Block Price Forecast – Expert Analysis & Trading Tips | Learn 2 Trade – Expert Analysis & Trading Tips | Learn 2 Trade: June 12th
The Lucky Block price forecast shows signs of a strong bullish reversal as buyers step in to counter the selling pressure. The price is now targeting the $0.00002600 key level.
LBLOCKUSD Long-Term Trend: Bullish (1-Day Chart)
Key Levels
Supply Levels: $0.00003190, $0.00002920
Demand Levels: $0.00002510, $0.00003940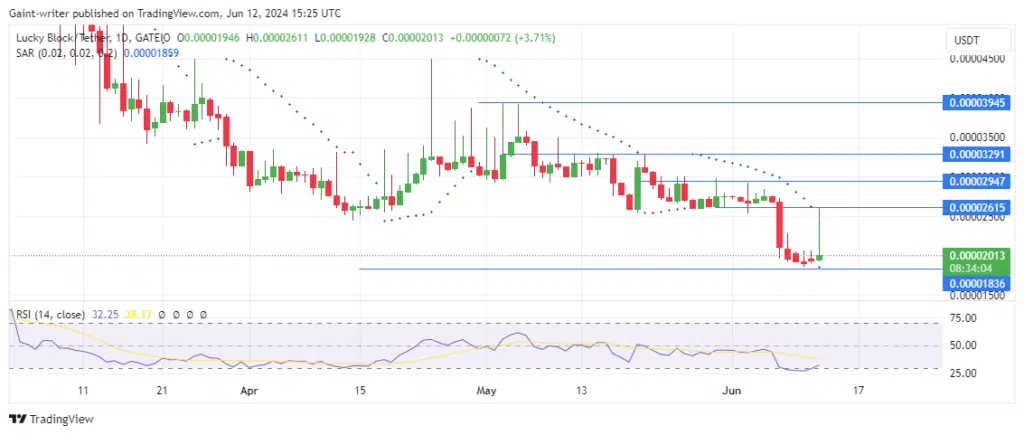
Lucky Block Price Forecast – Expert Analysis & Trading Tips | Learn 2 Trade – Expert Analysis & Trading Tips | Learn 2 Trade: LBLOCKUSD Outlook
Buyers have expressed their intention to push the price beyond the $0.00002610 significant zone. The market is currently shifting its focus towards a strong bullish reversal. The selling orders were held back after the price traded down to the $0.00001830 level.
Currently, the sell traders who had serious intentions have been defeated and exhausted. Buyers have taken over, demonstrating a strong liquidity rally up to the $0.00002600 key level. Recently, buyers have taken orders, thereby strengthening their position.
After taking long positions, the bulls have traded close to the $0.00002000 key area. This presents an opportunity for traders to join the flow again. Finding the best entry with the best crypto signals can open the door for additional profits. The Parabolic SAR Stop and Reverse has changed course to the bullish side, and the RSI (Relative Strength Index) is soon to indicate a bullish strength market.
LBLOCKUSD Medium-Term Trend: Bullish (4-hour chart)
On the 4-hour chart, buyers are pushing their luck, and another ride is bound to play out. The bulls are likely to fill the void created by the sellers, and the RSI is currently on the rise. This indicates that buyers are gaining strength.
How To Buy Lucky Block
Note: Learn2.trade is not a financial advisor. Do your research before investing your funds in any financial asset, product, or event. We are not responsible for your investment results.
- Broker
- Min Deposit
- Score
- Visit Broker

- Award-winning Cryptocurrency trading platform
- $100 minimum deposit,
- FCA & Cysec regulated

- 20% welcome bonus of upto $10,000
- Minimum deposit $100
- Verify your account before the bonus is credited





