

Lucky Block – Guide, Tips & Insights | Learn 2 Trade Price Anticipation: October 13
The Lucky Block – Guide, Tips & Insights | Learn 2 Trade price anticipation is that the present accumulation phase of the price will result in a breakout in the market.
LBLOCK/USD Long-Term Trend: Bullish (4-hours Chart)
Key Levels:
Zones of Supply: $0.0008360, $0.0005000, $0.0009860
Zones of Demand: $0.0003130, $0.0002980, $0.0001880
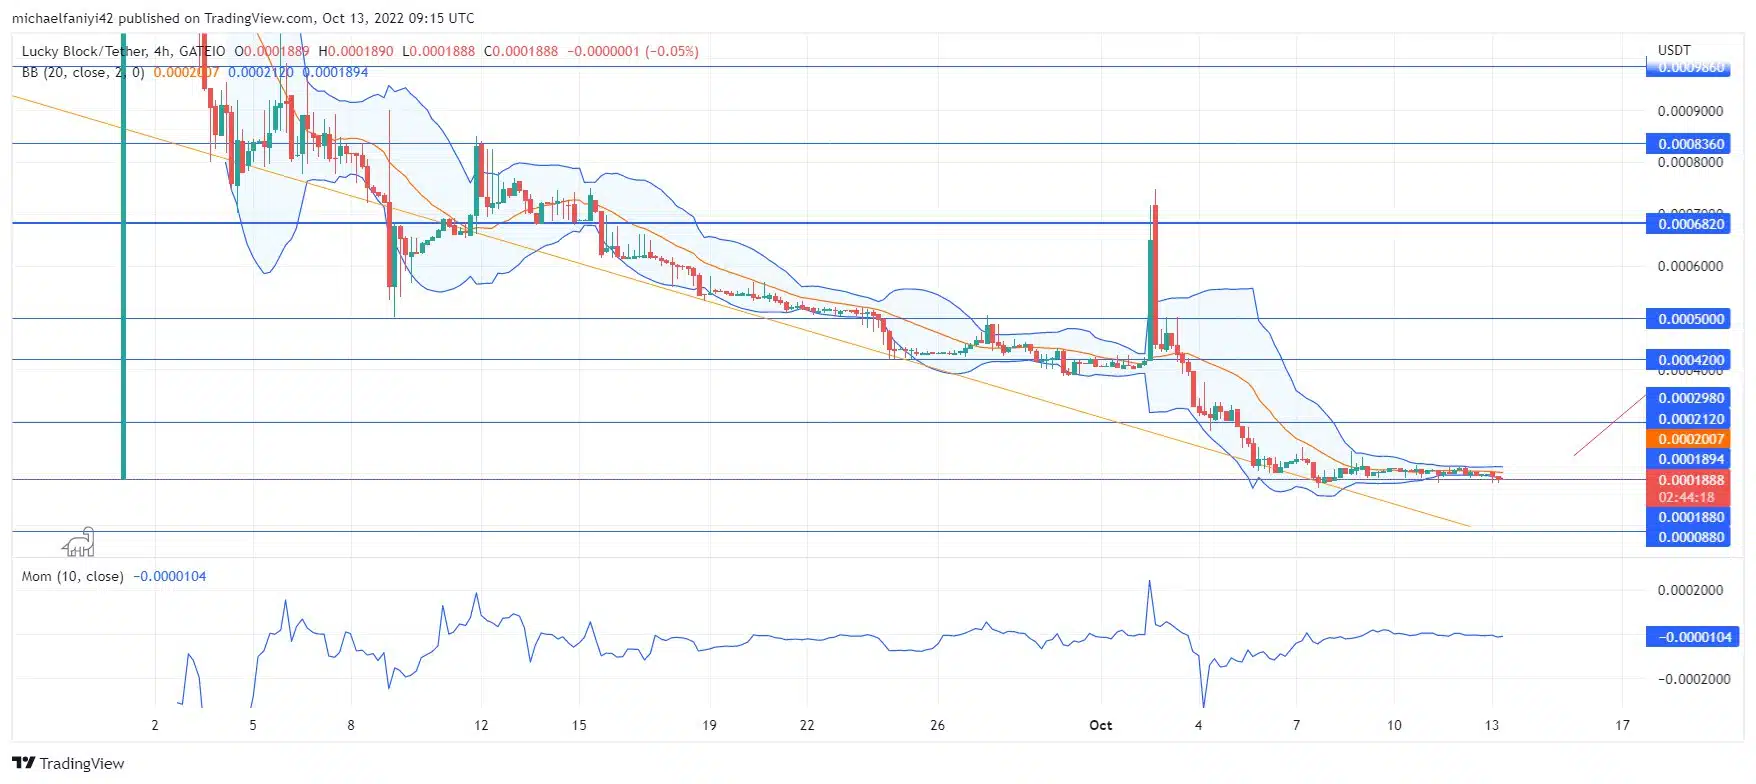
Lucky Block – Guide, Tips & Insights | Learn 2 Trade has put a stop to the bearishness in the market. The continued plunging started at the beginning of last month. In the downward plunge, several price levels got breached. Finally, the price dropped to the key level at $0.001880, bringing about a stop to the plunge. LBLOCK is now ranging and accumulating momentum for a potential breakout.
Lucky Block – Guide, Tips & Insights | Learn 2 Trade Price Anticipation: LBLOCK/USD Outlook
Lucky Block – Guide, Tips & Insights | Learn 2 Trade’s attempts to rally as a trendline led it downwards since last month. An instance of this is when it shot upward on October, 2nd. However, it could not hold above the key levels; it rose above and dropped back.
After expending energy for the failed upsurge, the price rolled down along the trendline. This continues until the coin dropped to a strong support level at $0.001880, diverting from the trendline to a sideways movement.
The Bollinger Bands have squeezed onto the 4-hour candlesticks to demonstrate the accumulation phase going on in the market. The Momentum indicator has also shown an increase in momentum gained in the market.
LBLOCK/USD Medium-Term Trend: Bullish (1-hour Chart)
On the 1-hour chart, the Momentum indicator lines move sideways after rising. Indicating that LBLOCK buyers are maintaining their momentum, pushing until they reach higher price levels.

Like the 4-hour chart, on the 1-hour chart, the Bollinger Bands have squeezed onto the candlesticks. This is also a sign of accumulation in the short term. The market is poised to surge upward after this accumulation phase. LBLOCK will be looking to reach $0.0009860.
You can purchase Lucky Block – Guide, Tips & Insights | Learn 2 Trade here. Buy LBLOCK
Note: Learn2.trade is not a financial advisor. Do your research before investing your funds in any financial asset or presented product or event. We are not responsible for your investing results.
- Broker
- Min Deposit
- Score
- Visit Broker

- Award-winning Cryptocurrency trading platform
- $100 minimum deposit,
- FCA & Cysec regulated

- 20% welcome bonus of upto $10,000
- Minimum deposit $100
- Verify your account before the bonus is credited


- Fund Moneta Markets account with a minimum of $250
- Opt in using the form to claim your 50% deposit bonus


