
BGB/USDT Price Analysis – Bitget Token consolidates near mid-band with fading momentum
BGB/USDT is currently trading around $3.490 market zone, showing mild gains after rebounding from the lower Bollinger Band near $3.477. While the broader structure remains corrective, price action has shifted into a stabilization phase, with volatility narrowing and momentum indicators showing early signs of fatigue. The market is holding above short-term support, but conviction remains limited.
BGB/USDT Market Key Levels
Resistance levels: $3.690, $4.750
Support levels: $3.320, $2.800
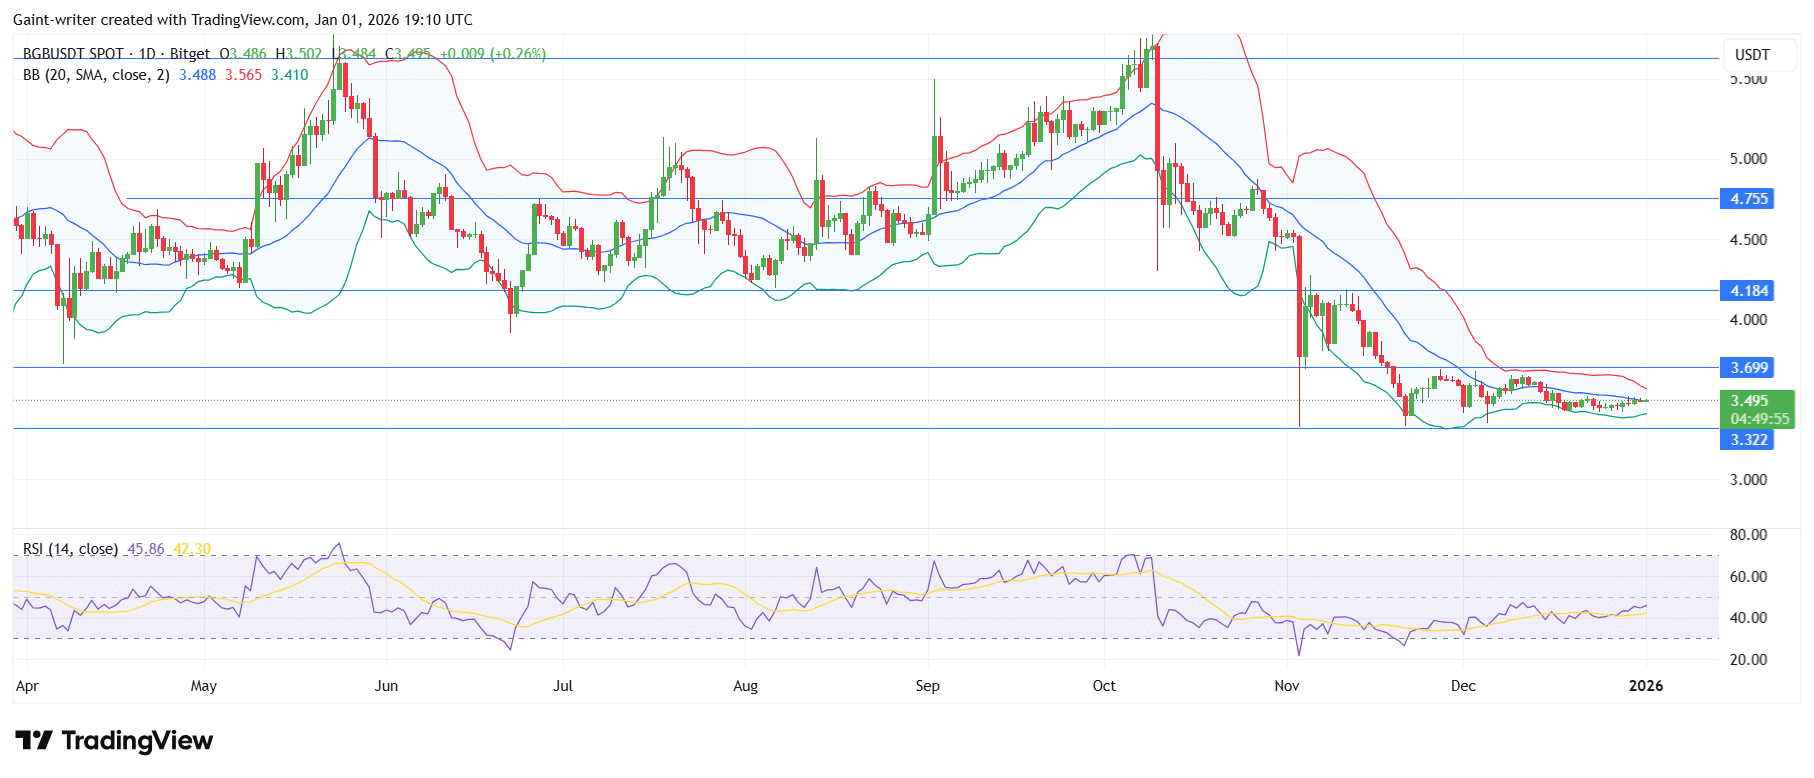

BGB/USDT Long Term Trend- Bearish (Daily Chart)
This pause does not yet qualify as a confirmed reversal. However, the narrowing Bollinger Band structure and flattening RSI suggest that directional energy is building. Price continues to oscillate near the middle band (SMA 3.490), reflecting balance between buyers and sellers. A decisive move above $3.50–$3.70 would be the first signal of bullish expansion, while failure to hold above $3.48 could reopen downside risk toward $3.32.
From a higher-timeframe perspective, BGB remains within a broader consolidation structure following its decline from the $4.10–$4.70 zone. The current price region around $3.49–$3.50 has acted as a pivot multiple times, and the narrowing Bollinger BandWidth reflects a market preparing for resolution. The RSI (56.00 vs. 55.48) shows modest bullish bias, but not yet strong enough to confirm trend reversal.
 BGB/USDT Short Term Trend- Bearish (4-Hour Chart)
On the lower timeframe, BGB is trading in a tight band with volatility notably compressed. Price is hovering near its short-term average, and candles show reduced range and volume. This type of behavior typically precedes expansion, with the breakout direction determining the next impulse.
A breakdown below $3.48 would expose $3.32 as the next support zone. Conversely, a sustained close above $3.70 could trigger a move toward $4.18, where prior resistance remains structurally intact.
Make money without lifting your fingers: Start using a world-class auto trading solution
How To Buy Lucky Block
Note: Learn2.trade is not a financial advisor. Do your research before investing your funds in any financial asset, product, or event. We are not responsible for your investment results.
- Broker
- Min Deposit
- Score
- Visit Broker

- Award-winning Cryptocurrency trading platform
- $100 minimum deposit,
- FCA & Cysec regulated

- 20% welcome bonus of upto $10,000
- Minimum deposit $100
- Verify your account before the bonus is credited


- Fund Moneta Markets account with a minimum of $250
- Opt in using the form to claim your 50% deposit bonus


